 At GSA, we track current industry benchmark data through our real-time dealer 20-group data reporting analysis and comparison system. This month, we’re going to look at actual August data from one of our better 20-groups. This group is made up of mid-sized dealers. They averaged gross sales of just over $3 million through August. Using selected fields from one of our reports, we will show some of the stats from a different perspective.
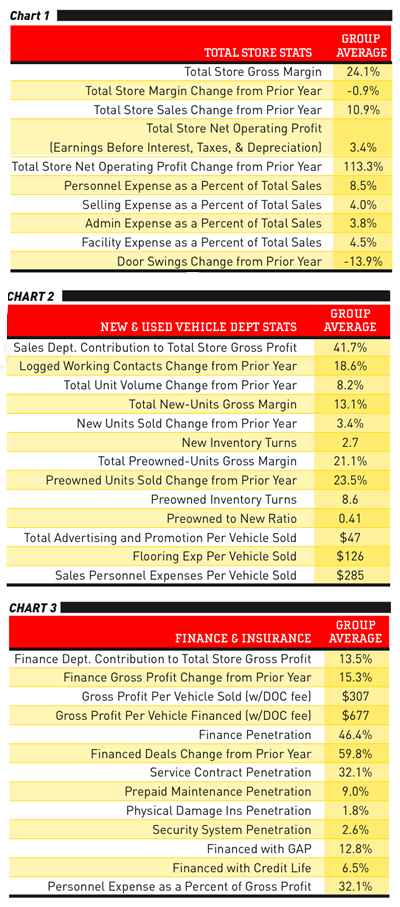
When you look at Chart 1, most numbers are up as shown from the percent change from prior year percentages. By comparison with this group, BOC is showing a 26.4 percent gross profit margin. Particularly significant is net operating profit — at 3.4 percent, it’s up 113 percent over last year. TBOC was only slightly better at 3.8 percent. That said, this group’s expenses are still too high. Using expenses as a percentage of total sales (rather than a percent of gross profit), total expenses shouldn’t exceed 20 percent of total sales. If a dealer can maintain a gross margin of 25 percent with 20 percent expenses, the return on investment — operating profit — would be 5 percent.
Total store sales are up 11 percent, but total store margins slipped about 1 percent. Door swings are down, but they are making more sales. Does this mean they are getting more serious buyers, or are they using better sales processes? It could also come from better personnel with better training. Training your personnel is even more important today than in the past. You have to get maximum performance out of every person on your team. Make them all “A” players.
Chart 2: New in this report is each department’s contribution to the total store gross profit margin. Negative numbers are not acceptable. Notice the upswing in working contacts. This is interesting when you consider that door swings went down. Part of this is training and accountability, as they have to be tracking these people.
Notice the 23.5 percent increase in preowned unit sales as well as the 8.6 inventory turns! This is where the money is. Preowned sales will grow faster as units get more scarce.
In Chart 3, we see a 15.3 percent increase in F&I gross profit from last year. Their finance penetration is fairly good at 46 percent, up almost 60 percent over last year. This is really significant — they are getting customers financed. If you are not in this range, you need to look at your processes and perhaps your F&I staff. This is not regional — we are seeing this type of penetration across the country.
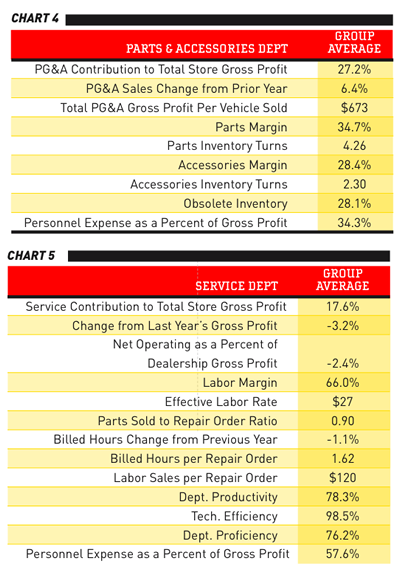
Chart 4 shows a slight increase in PG&A sales, but somewhat low parts margins — TBOC is at 38 percent. Turns are good. You need to maximize stocking of inventory that turns four-plus times a year and reduce the slow movers. However, if you start seeing six-plus turns a year, you may not be stocking enough and could lose business in the long run. Accessories turns are poor, and the obsolescence (12 months with no sale) is bad. The goal here is to keep it under 20 percent (lower if possible).
The service stats in Chart 5 show lower gross and net profits and fewer billed hours. This group’s average margin is too low — it should be around 70 percent (revenue-tech compensation not including benefits = gross profit). TBOC is at 73 percent. Tech efficiency (billed labor hours divided by actual hours worked) should be 100 percent-plus — this measures speed and can reveal management, training or tracking issues. Productivity (actual hours divided by available hours) measures the service manager’s ability to keep work flowing through the department. It should be closer to 85 percent. Proficiency (billed labor hours divided by available hours) suffers because of this — it should be around 85 percent as well.
Notes: Availability should be the hours the tech is scheduled to work — not when they show up. Some folks reverse the definitions of productivity and proficiency. Either method is acceptable.
I hope you have found this information useful and that you’ll use it to compare your dealership’s performance. It’s important to your survival to know what is going on in your business and to have reference points for comparison.
At GSA, we track benchmarks through our involvement with dealer 20-groups. The TBOC data comes from the groups that are in the a real-time, web-based data reporting system. National Norms are compiled from the groups that report in the former-RPM data system.
Steve Jones, GSA senior projects manager, outlines dealership best business practices to boost margins, increase profitability and retain employees. His monthly column recaps critical measurements used by the leading 20-group dealers. GSA is recognized as the industry’s #1 authority on dealer profitability.