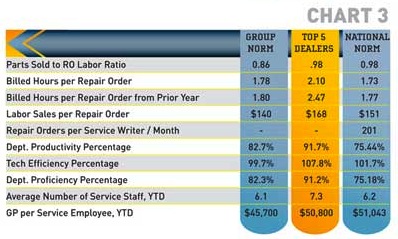
September Service Department Performance
This article contains actual numbers obtained from our 20-group data reporting and analysis system. 20-groups consist of dealers from non-competing markets who meet three times a year to share financial and best practice information. Their goal is to grow and improve their businesses profitably. Chart 1 shows some key performance indicators for the overall store.
August 2014 Parts, Garments & Accessories Department Performance
In this month’s total store stats (Chart 1), we find that sales are still growing slowly, but steadily. Since they started the year in negative numbers, this is good news. Keep in mind that these are percents of change, not percent increase numbers. More good news is that overall store margins are up across the
July 2014 F&I Department Performance
This article contains actual numbers obtained from our 20-group data reporting and analysis system. 20-groups consist of dealers from non-competing markets who meet three times a year to share financial and best practice information. Their goal is to grow and improve their businesses profitably. As you can see from the Total Store stats, sales
June Year-Over-Year Comparison
In our June year-over-year (YOY) comparison total store sales (Chart 1) were up around 10 percent for both the group and National Norm (NN) dealers. This is a very good sign. Total store gross margins declined slightly, indicating dealers were probably discounting product since expenses were not showing significant increases. Net Operating Profit was fairly
May Sales Department Performance
This article contains actual dealer data obtained from GSA’s 20-group reporting system. 20-groups consist of dealers from non-competing markets who meet 3 times a year to share financial and best practice information. Their goal is to grow and improve their businesses profitably. In Chart 1, total store gross margins are still light for this group
April Service Department Performance
"/wp-content/uploads/Articles/06_01_2014/128171BOCjpg_00000076973.jpg"> In this month’s Best Operators Club, the article contains actual numbers obtained from our 20-group data reporting and analysis system. 20-groups consist of dealers from non-competing markets who meet three times a year to share financial and best practice information. The goal is to grow and improve their businesses profitably. GSA provides support, data
March PG&A Department Performance
In the first chart (Chart 1) we see some promising numbers. Total store sales are up over last year as are gross profit margins. We also see that the parts, garments and accessories (PG&A) department represents a very significant portion of the total store gross profit. In the case of the Top 5 dealers, it
February 2014 F&I Department Performance
Although February does not give us much depth for the data, we still get an early peek at what the market has been doing this winter. Total store sales were up across the board and margins came up almost 2 points for this group (Chart 1). The Top Five dealers are just above that benchmark number
January 2014 Sales Department Performance
In looking at the Total Store Stats (Chart 1) we see that 2014 started off with a bang when compared with last year. There was a significant improvement in Total Sales dollars when compared with last year.
December 2013 Year End Dealer Data Report
All-in-all, 2013 was a decent year. You can see from Chart 1 that total store sales were up, as was Net Operating Profit (NOP) – albeit slightly. Overall store margins slipped a small amount for the group and the Top 5, but increased slightly for the National Norm (NN) dealers. The Top 5 continue to
November 2013 Service Department Performance
Marketing your dealership is an important part of staying ahead and remaining profitable. Many dealers have improved significantly by increasing their marketing efforts.
PG&A Stats Indicate Stability Returning To Industry
This month, we’ll be comparing September data from a good-performing metric 20-group with the National Norm (NN) numbers and the averages for the Top 5 dealers for this group in each category. These stats changed relatively little for most categories compared to the numbers I reported back in May 2013. That is a welcome indicator