At GSA we track benchmarks through our involvement with dealer 20-groups. Some of the members have kindly consented to let us share their numbers. The TBOC data comes from our real-time, web-based data reporting system. The National Norms are compiled in our former-RPM data system. Altogether, these numbers represent the data collected from over 200 high-quality dealers.
The following article deals with October numbers and includes the TBOC data from one of the better-performing groups compared with the National Norms. I have also included the YTD National Norms data in some of these charts.
In Chart 1 you can see that dealers were still struggling to get to that 25% Total Store GP. However, it was good to see positive NOP for TBOC, small though it may be. The rate of revenue change was better in September than it has been in months. However, it fell back for some of the NN dealers in October. Still, I take these to be positive signs, and hope they will hold up in the coming months.
The NN dealers still need to work harder on getting personnel expenses in line. This is a tough area to tackle, but it represents a huge part of dealership expenses as a portion of GP. Not controlling personnel expenses has "killed" a lot of dealers in the last few months. It is vital to do whatever it takes to get it in line with industry standards.
PVS/PUS = per vehicle sold
TBOC = average of top 5 BOC members (based on store GP)
NOP = Net Operating Profit
NN or N Norm = National Norms (data compiled from multiple groups).
Chart 1

Click to Enlarge
Now we’re going to look at a new area of the numbers. Instead of dollar data, it is customer data. Chart 2 shows the NN traffic and closing data. This chart points out the value of having door counters. They are generally inexpensive (starting around $100). The most frequent objection I hear is that they are never accurate because of the employees going in and out, etc. It doesn’t matter. It all averages out. Get door counters for your store and start tracking these numbers; verify the response to your advertising and promotions. Find out what your sales staff is doing with these people.
Chart 2

Click to Enlarge
YTD door swings were down 35% compared with 2008. However, for October they were only down 30%. This is another small but positive economic indicator. Overall, the percentage of the customers greeted (as recorded on the traffic log) that sat down with a salesperson has not changed as much as I expected. Neither has the percent of write-ups or closes. Although the YTD numbers are down, there was an improvement in the percentage of deliveries for October compared with last year. Looking at the GP numbers, it is apparent that dealers are clearing all the inventory they can.
Chart 3

Click to Enlarge
Chart 3 recaps some of the other key performance indicators for our business. Here you can see just how dramatically the sales department’s personnel expense impacts cost per unit sold.
This should be reinforce the fact that you need to be extremely adept at understanding the numbers and controlling your expenses, particularly, personnel expenses. Many dealers are putting in a lot more floor time in their dealerships in order to reduce staff. Others are utilizing part-time people to handle peak business periods. You have to have good data in order to address this in your dealership. The number of dealer failures is at an all-time high. Please don’t become one of them.
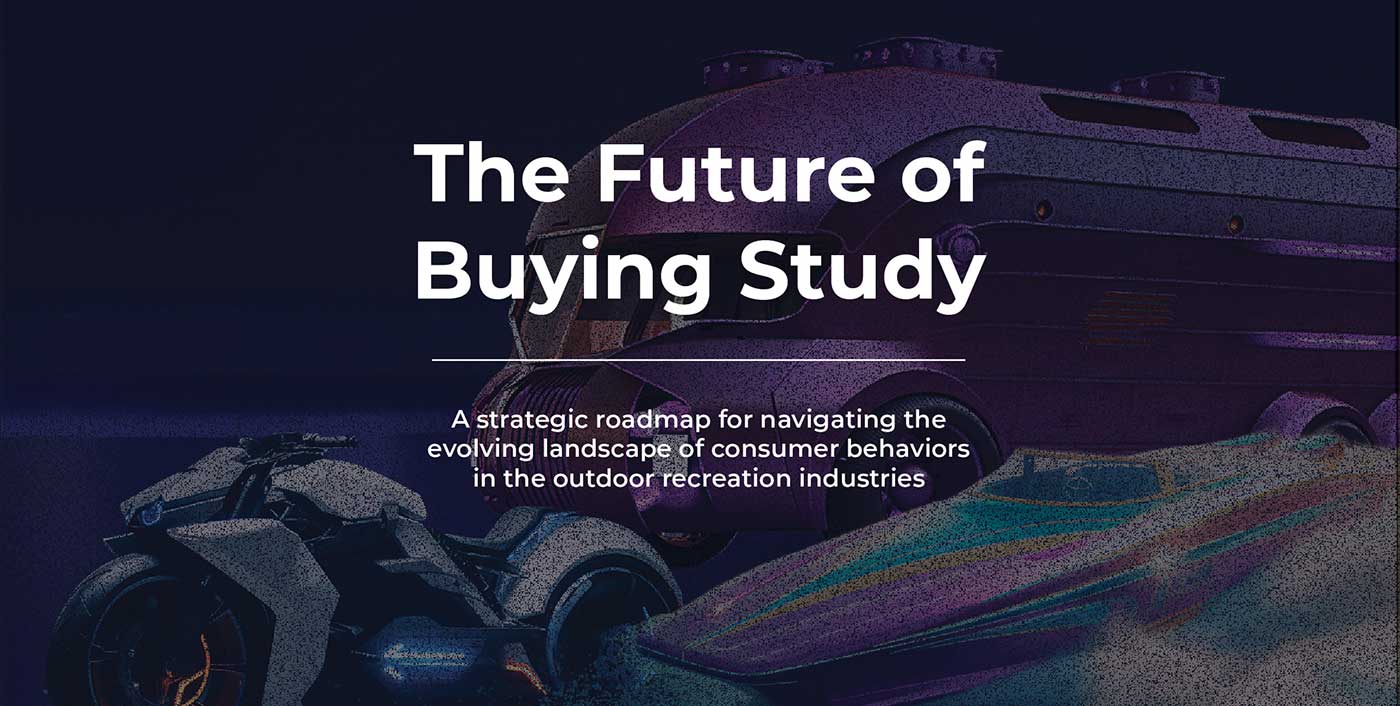


How to Grow and Excel in Digital Retailing
This recorded AIMExpo education track discusses the world of digital retailing and why you need to be there.
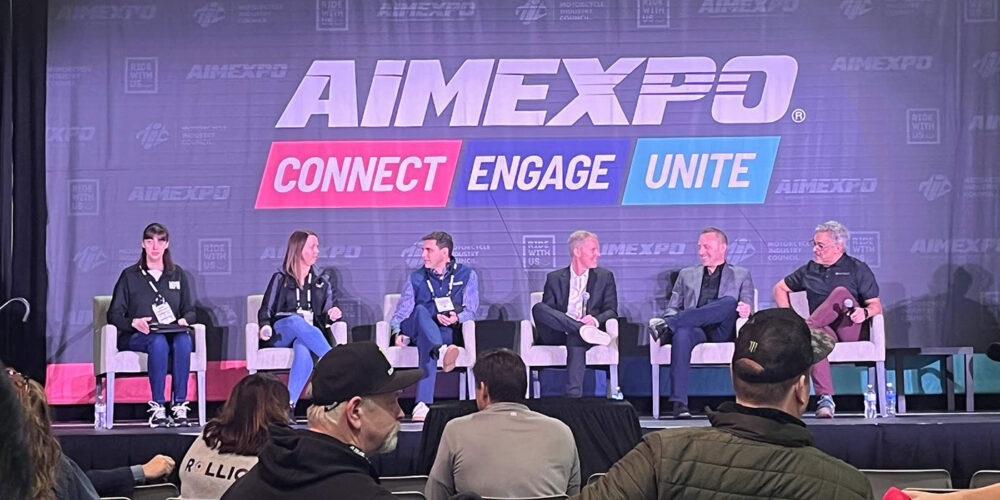
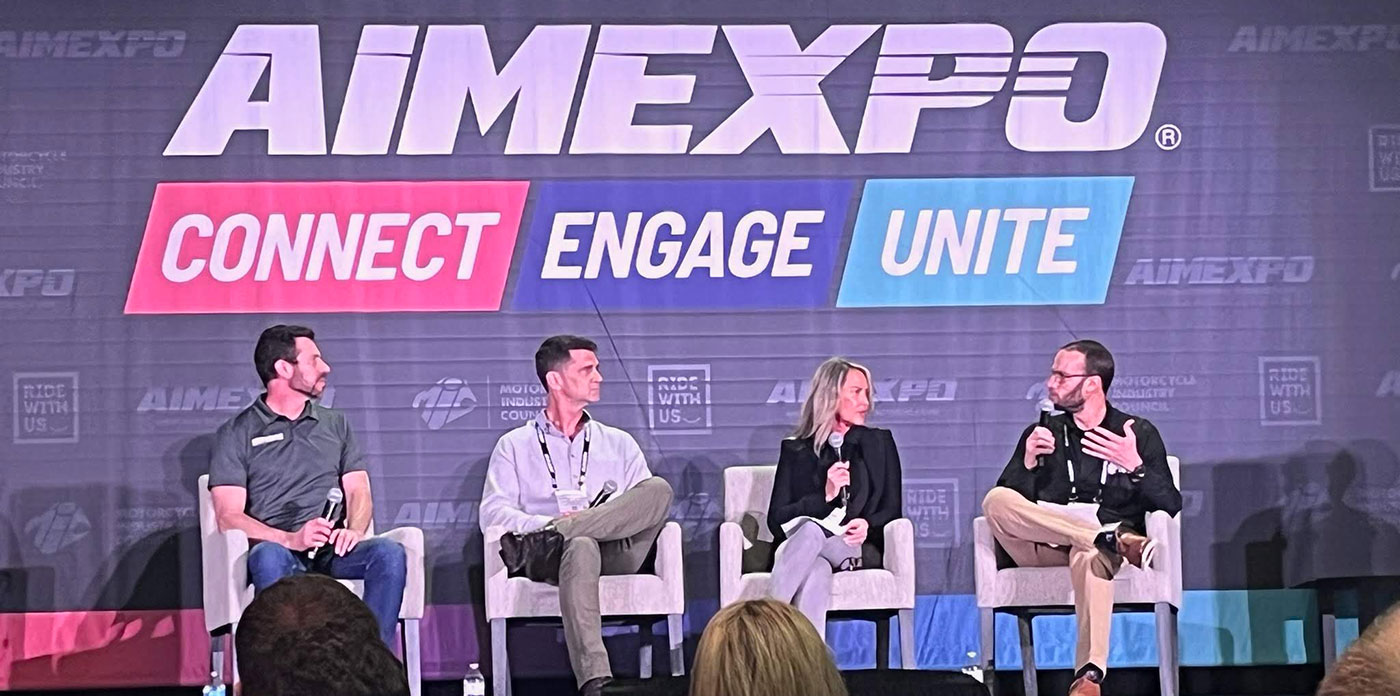
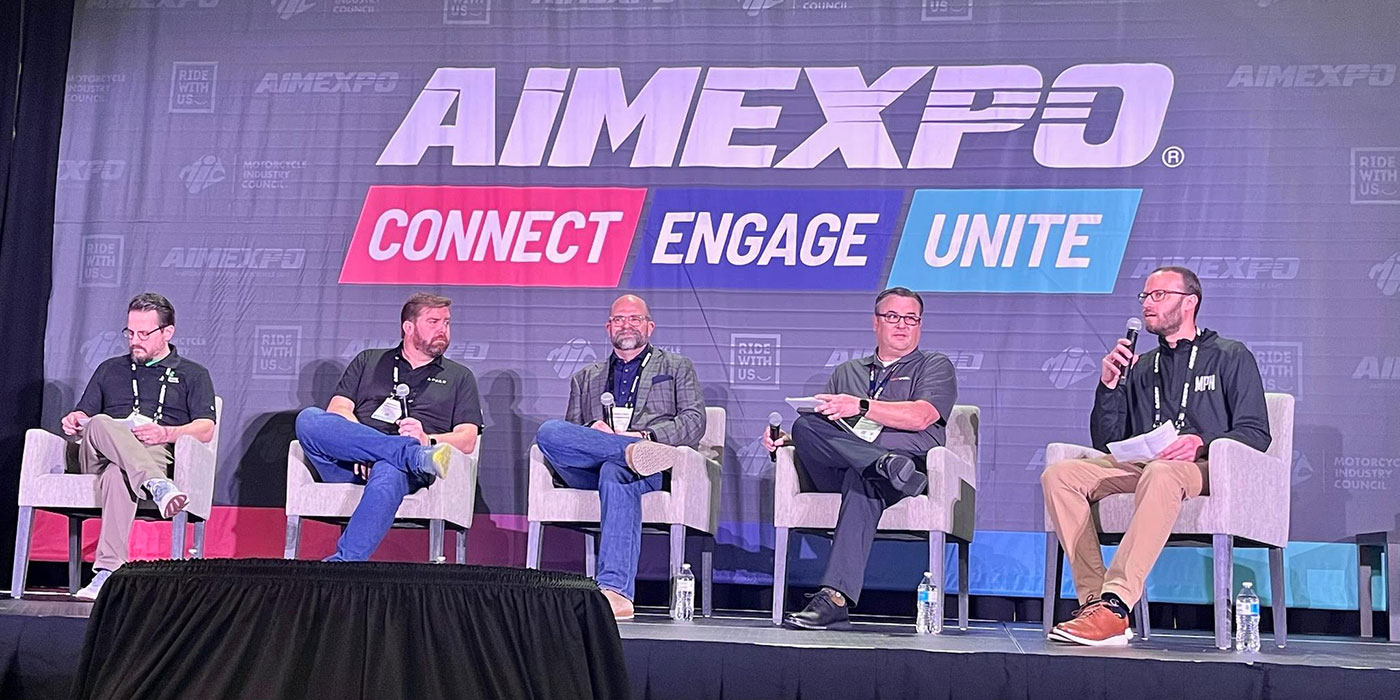
At AIMExpo 2024, Meagan Kusek, editor for MPN, moderated the marketing panel in MPN's Dealer Excellence education track. The panel consisted of Johnathan Aguero of Transax, Jason Nierman of Rollick, Mike Wyrzykowski of Blackpurl, Troy Snyder of Trader Interactive and Martine Nuera of DX1.
In this session, Kusek and the panel discuss what digital retailing is, why dealers need to be in the digital space and how they can excel there. The panel relates how the digital user experience has changed, how to manage digital leads, best digital retailing practices and even how artificial intelligence (AI) might affect dealers in the future.
NPA Pre-Owned Market Update: February 2024
Average wholesale prices continue to improve, reflecting dealer sentiment and demand for pre-owned.
Establishing the Right Pay Plan for Your Dealership’s F&I Team
In an industry where skilled F&I professionals are in high demand, an attractive, fair and equitable pay plan becomes a key tool.

Maximize Every Sale With F&I and PG&A
This recorded AIMExpo education track discusses how the bike is just the start of the sale.
Elevating Your Sales Game Through Parts Packaging
Breaking down the art and science of a well-designed, customer-focused, profit-friendly parts package.
Other Posts
Unleash Your Experts: How to Be a Long-Tail Resource for Powersports Enthusiasts
Closing deals and providing service are a dealer’s bread and butter, but your dealership has far more to offer.

Building a Growth Stategy With a Powersports Playbook
Success isn’t a fluke, and it’s not luck. It’s a strategy.
Fostering an F&I Culture That Sells
Dealership success hinges on the ability to cultivate a strong F&I culture.

Increasing Profits Through Accessorizing
Go out and find the units to dress up — there’s lots of extra profit to be made.