At GSA we track benchmarks through our involvement with dealer groups, such as the Best Operators Club. The group’s by-laws require members provide accurate dealership operations data on a monthly basis, and the group has kindly consented to let us share the numbers we are getting from our Best Operators Club members. This kickoff column explores the current sales department new unit benchmark data. Future columns will address the numbers from the other departments. We will discuss what we measure, and why, as well as the current BOC benchmarks.
Chart 1 depicts actual December ’07 sales department numbers for a real BOC dealer. This is a fair-sized, multi-line dealership located on the outskirts of a sizable metro market. He sold just over 1,600 new units and almost 400 pre-owned in the 2007 calendar year. He is well-respected for his profitability. This dealer’s inventory level might be high for December. This is not unusual, as we were suffering from slow sales nationwide. Despite the economic effects and seasonality in his northern market area, he retailed 113 new units in December. He also maintained an exceptional gross profit margin of almost 18% on new unit sales.
Chart 1
The abbreviation C/M stands for current month. PVS stands for per vehicle sold. COGS (cost of goods sold) only includes shipping and make-ready for the units sold.
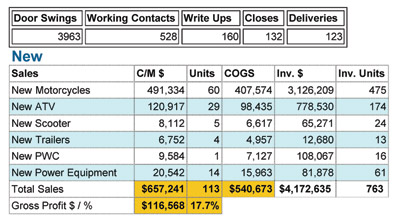
At the top of the chart are some essential numbers. Most dealers monitor door swings with electronic counters. Comparisons of this data over time reveal traffic trends and the effects of advertising and promotion efforts. Comparing the door swings with the contacts (traffic log), write-ups, closes and deliveries provides the basis for necessary sales performance measurements. Tracking data like this allows you to analyze what it actually costs to bring a person into your store or close a sale.
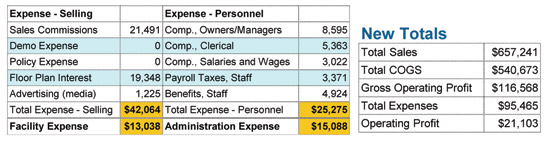
Note that facility (and sometimes admin) expenses are allocated to every department. The basis for this allocation differs among dealer groups (square footage, percentage of sales, actual costs, etc.). The important part is that all the group members use the same method, so the data is comparable. Net profit for new unit sales in December was $21,000 or 3%.
Chart 2
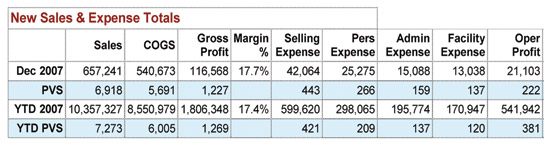
This second chart shows this dealer’s overall sales performance for December and year-to-date. Note that he held a 17% gross profit margin for the entire year! The PVS numbers can be useful for comparison purposes, regardless of the size of your dealership.
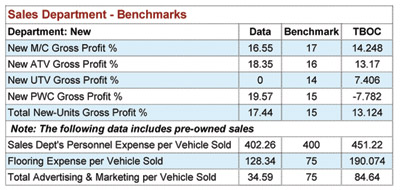
Table 3 shows some of the basic benchmarks that are derived from the data entry. The Data column is the dealership’s numbers for the month of December. The Benchmark column is a stretch goal that is reviewed and revised by the group at each of their three annual meetings. The "TBOC" is what we consider as the state-of-the-industry for this group. TBOC stands for the top of the BOC and is comprised of the average for the top five members in this category. This dealer not only exceeded the TBOC in many areas, he also beat several of the group’s benchmark targets. While his flooring expenses are high per vehicle sold (remember that inventory figure?), the TBOC number is even higher. Again, this reflects the current industry situation (slow sales, high inventories). You can also see where a part of the reason he is so profitable is that he has been able to control his advertising and marketing expenses.
Chart 3
These charts provide you with a snapshot of what has been happening in the sales department for this particular dealership and this group for the month of December. Hopefully, you will be able to use some of this information for comparison in your dealership. Remember, you can’t fix what you don’t know is broken. Identifying the opportunities is half the battle. If your sales ratios and percentages are way off the mark, you need to take the necessary steps to get them in line in order to be profitable. The steps to fix the problems will differ with each individual dealer’s situation.
If I have one goal in all this, it would be to get more dealers educated in the fact that there are performance and profitability benchmarks. Knowing what those numbers are, and the importance of comparing their numbers with these benchmarks is an important tool. If we could get more dealers to seek solutions from competent industry experts when the numbers don’t jive, we could make a significant difference in the profitability and even survival of powersports dealers.
Sadly, many dealers who are not involved in 20-groups don’t take the time to understand and compare their data with benchmarks. Doing so will help expose problems ("opportunities" as we call them). Some dealers who do this are left with; "So what do I do now?" The wiser ones will seek the aid of knowledgeable dealers or specialized powersports consultants like GSA. The ones who don’t seek the solutions end up crashing in flames when the market gets tough.
Note: Our data reporting and analysis system is available for any dealership to use for a nominal fee. If you want more info on the Voyager IV data reporting system or BOC, please e-mail [email protected] or visit our website at www.gartsutton.com.


Pedego Unveils 2024 Electric Bike Models
The models are the Moto, Cargo and Fate Tire Trike.

Pedego has unveiled the latest additions to its lineup of electric bikes. The three groundbreaking additions — Moto, Cargo and Fat Tire Trike — set a new standard in safety, quality, performance and innovation within the e-bike industry.
“This is officially the next generation of electric bicycles,” said Pedego CEO Brian Stech. “Built to exceed the industry’s highest standards, each bike is outfitted with cutting-edge technology available only to Pedego customers, offering riders industry-leading safety, increased range, numerous customization options and ultimately a superior riding experience for all.”
Race Winning Brands Transitioning to Unilateral Retail Pricing Policy
RWB aims to preserve the quality and reputation of its products.
Parts Unlimited Welcomes New South Central Region Sales Rep
Joby Windmiller comes with several years of powersports industry experience.

Honda to Support MotoAmerica Mini Cup
The youth-focused championship is open to riders of Groms and some CRF-F models.
The 2025 KTM XC Range
Ready to take on cross-country duties.

Other Posts
Zero Motorcycles Launches Tesla Tap Mini: the Key to Expanded Charging Options
The accessory expands rider access to more than 40,000 additional charging destinations across the country.
Turn 14 Distribution Adds Gaerne to the Line Card
Gaerne is an Italian motorcycle footwear brand.

Royal Enfield Introduces Global Rentals and Tours
The rental program extends to 60-plus destinations.

Segway Powersports and Octane Shift Gears With Strategic Financing Partnership
Effective, April 1, 2024, prime and non-prime consumers are eligible for financing on Segway’s entire range.