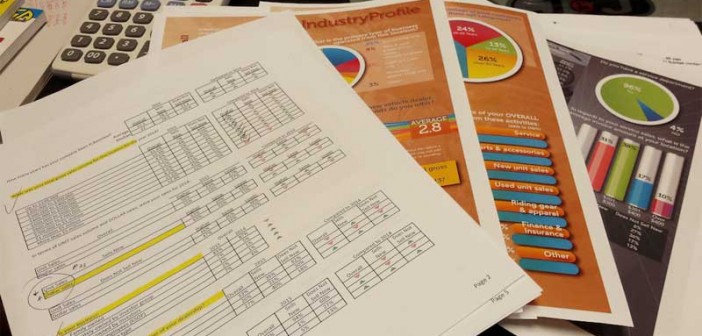
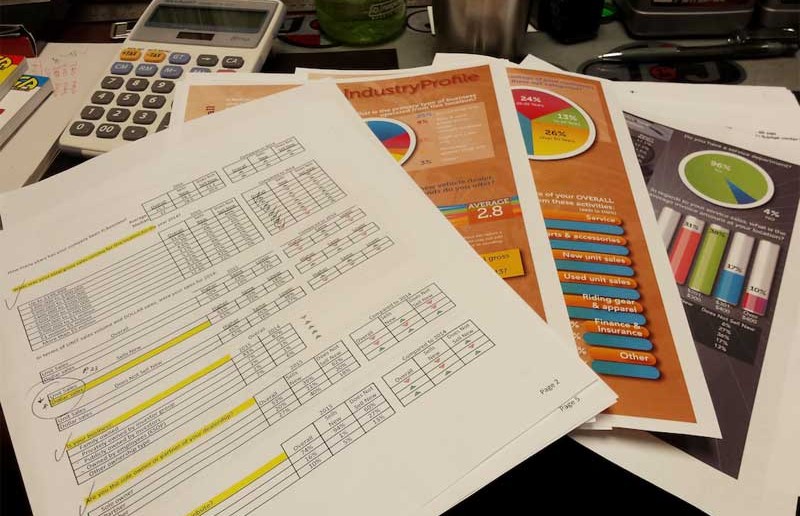
[dropcap]H[/dropcap]ow do you measure an industry’s performance from a relatively small sample? There is a method to our madness, and as our new Babcox Research Manager Kent Camino explains, it all comes down to confidence. With a small margin for error factored in, we are confident that our latest Powersports Industry Profile, is accurate to within 95 percent. That’s a standard acceptance level for such surveys, but remember the margin for error, too.
This year, our random sampling of dealers contained some interesting nuggets for sure. First of all, the number of respondents who were franchised dealers vs. non-franchised dealers was split nearly down the middle. This is a good thing in my opinion, but it differs quite a bit from previous years where more than 90 percent of the responses were from franchised dealers.
We followed all of the standard practices for conducting a survey, but we may have had a larger pool to choose from. Instead of randomly selecting from, say 6,000 dealers, we chose to sample from our entire database of more than 15,000. The result is, we believe, the most accurate survey we have ever done.
We decided it would be helpful to see trends more easily, so we compare this year’s numbers with the previous year by an up or down arrow graphic next to some of the charts. We also broke out the dealers who sell new vehicles (Sells New) from those who sell service and apparel and used vehicles (Doesn’t Sell New). But what we’re really excited about is how this information can be used to gain insight into your business and for future planning. We wanted to note the trends as much as possible because we think it gives a more complete picture of how the industry is performing in the key areas of marketing, sales, personnel and overall dealership operation.
One of the more striking examples of what the survey illustrates is that there are many of you at the extremes. More dealers reported to carry more than four OEM brands, and more also said they only carried one OEM line. We think this coincides with another chart on gross sales volume. There were more small businesses up to $500,000 compared to last year. In the more than $5 million range, franchised dealers dropped from 25 percent to 22 percent. On the other hand, non-franchised dealers picked up considerably in this category with a gain of 4 percent.
A white paper of this information will be available to download from our website after this issue has been published. We hope this survey is helpful, but if it is not, please let us know how we can do better.