 In this article, we’ll review November 2012 year-to-date total store and sales department numbers. Since December’s year-end data is not yet available, this will provide a snapshot of how 2012 is turning out as compared with last year. We’ll compare a good-performing metric 20-group with the National Norm (NN) numbers and the averages for the Top 5 dealers in each category.
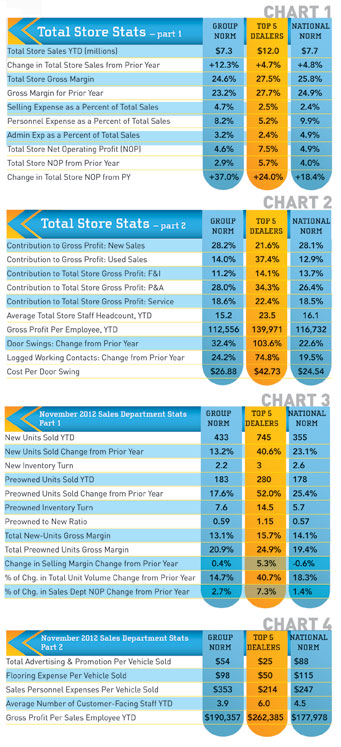
As you can see from these numbers, total store sales were up for 2012 versus 2011. Both the Top 5 and the NN dealers showed around a modest 5 percent increase over 2011, while the group averaged a healthy 12 percent increase. All-in-all, the NN number was consistent with the slow but steady growth pattern we have observed for the last couple of years.
Note the improvements in gross margin for the group and the NN dealers. The target benchmark is 25 percent in order to cover expenses and show a net profit. The Top 5 dealers stayed pretty flat with a very respectable 27 percent-plus margin.
More significantly, net operating profit (NOP) was up considerably across the board. This is partly a reflection of their continued efforts to control expenses. However, this is even more attributable to their ability to improve the performance and output of their employees. They have eliminated non-performers, hired better people and provided them with quality training. We are seeing evidence of this in the increased attendance at our management workshops and the demand for on-site staff training. The success of your business is directly related to the abilities of your employees. Invest wisely in your staff, and you will reap long-term rewards.
Part 2 of our total store stats shows us the average percentages that the various departments contribute to the gross profit of the dealership. It is interesting to note the flip-flop in new sales versus used sales contribution between the group and NN dealers as compared with the Top 5. I suspect this had a lot to do with the higher total store gross margin for these dealers.
The Top 5 dealers are obviously larger operations, as you can see from the staff levels. However, note how much more they average in gross profit per employee than the other dealers. These are the dealers who have a low tolerance for poor-performing employees and tend to be more proactive when it comes to investing in training.
The sales department numbers show us that sales have continued to improve, but selling margins have remained flat for all but the Top 5 dealers. Properly trained salespeople with proper incentive programs will fight harder for your profit. Untrained salespeople with no gross profit incentives become order-takers who drop to the lowest price quickly so they can close the deal. Spend some time on your sales floor listening to what they are saying to your customers. It could be enlightening.
The Top 5 dealers are continuing to focus on preowned. The margins tell the reason why. Check out the number of turns. This is huge. Frequent turnover increases profits dramatically. The really good news is that NOP for this department is also increasing. Gross profit pays the bills, but net is what keeps the business going and growing.
Sales – Part 2 reveals some good numbers you can use for comparison. What are you spending in advertising per vehicle sold? How about flooring? The last number on this chart really points out what can happen when you have well-trained salespeople and you focus on turning high-margin units. The Top 5 dealers are averaging $80,000 more in gross profit per salesperson than the NN dealers. Multiply that by six average salespeople. That’s $480,000 in additional gross profit for the sales department. Wow. Think about it.
Have questions? Feel free to contact me for information, explanation or to discuss how GSA can help you grow your business profitably.