This month, we’ll analyze the year-end data from our groups. As you can see from the last article, things were trending steadily upward. In this article, we’ll review the overall store data, as well as key department performance indicators. As in past articles, we’ll compare a good-performing metric 20-group with the National Norm (NN) numbers and the averages for the Top 5 dealers in each category.
I’m not going into a ton of detail here, since the numbers pretty much speak for themselves. I have tried to select the most pertinent data for each
department, as well as most of the comparisons with last year. The primary focus is on what happened with sales and profits.
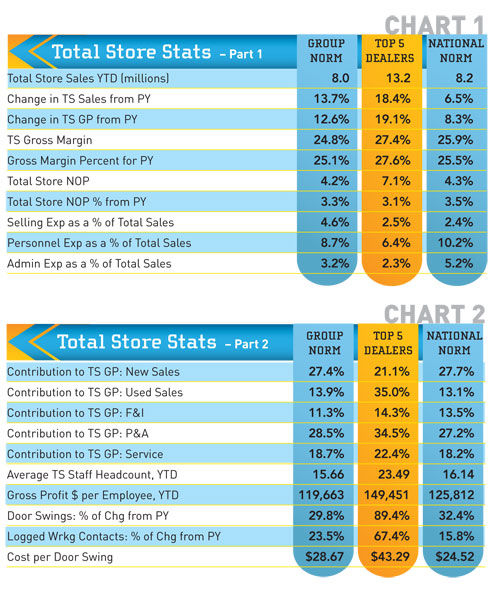 As you can see here, everyone increased total store sales and gross profits for 2012. Note that the Top 5 dealers selections can change from month-to-month since these figures are based on the top performers by line item by month. The difference between the group’s total sales increase for November (4.7 percent) and their year-end total sales of 18.4 percent doesn’t necessarily indicate that they sold the heck out of stuff in December. However, it does seem that December was strong across the board since all three groups showed healthy increases.
Total store gross margins remained relatively flat, but dealers had a lot more dollars to work with and, more importantly, net profits were up significantly.
The rest of the total store data chart is made up of some key performance indicators you can use for comparison with your store. Door swings and logged working contacts were up significantly, reflecting increases in traffic flow and improvements in sales processes.
New and preowned unit sales volumes were up significantly, as was the net profit for the sales department. Check out the increases in preowned sales volume. This is a result of the shift in focus from new to preowned that many dealers made last year. This was partially driven by a lack of available new product in some cases, but it was also driven by the obvious high margins and increased turns they could achieve with preowned. The preowned-to-new ratios show that the group and National Norm dealers were selling more than one preowned to every two new units (0.59:1). The Top 5 were selling at a one-for-one ratio.
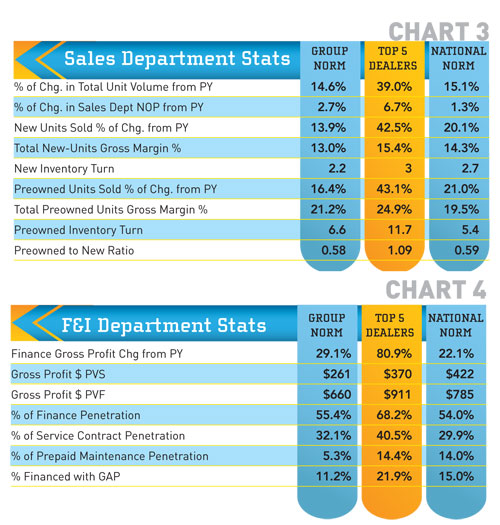 F&I is back with significant increases in gross profits over last year. Gross profit per vehicle sold and per vehicle financed are much improved. Not fabulous, but better. Again, these numbers are generally much higher for the H-D dealers. Per vehicle sold and per vehicle financed measurements provide you with realistic, attainable targets for your F&I department. The key here, as it is with every department, is having the right staff and providing them with high-quality training on an ongoing basis. It’s not rocket science, just practical wisdom.
PG&A sales are motoring right along. Considering the unit volume increases, the per vehicle sold numbers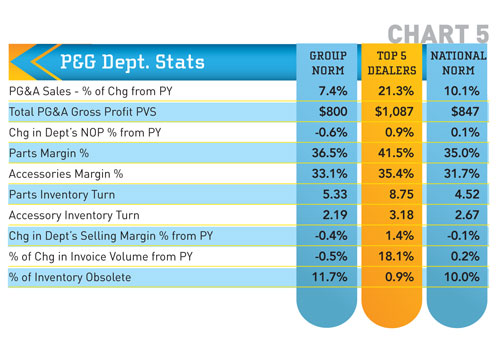 look pretty good. Net operating profit remained flat, but the margins are decent. If your margins aren’t this good, eliminate any discounting to other departments (e.g. sales or service), make sure your escalators are set up correctly, make a commitment to hold margins, and train your staff to sell instead of discounting.
Accessory inventory turns could be better, but they are average from what we see in dealerships. Parts turns are good, but seem high for the Top 5. My guess is that these dealers may have access to reduced-rate overnight or two-day shipping with their suppliers. This might also reflect proximity to the OE warehouses. Regardless, we recommend you keep it above four but under six turns. This generally indicates adequate stocking for service parts as well as for customer needs.
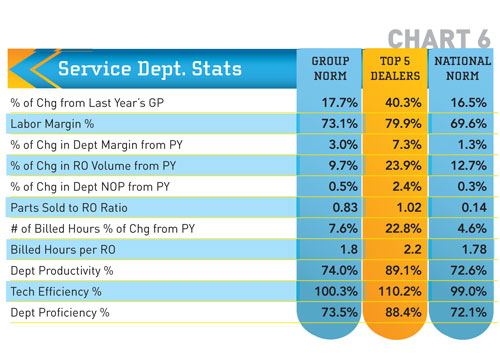 Wow, we are seeing good improvements in service. This was a focus for this group as well as for many dealers in our other groups. Gross profit dollars were up as was the gross profit margin and net operating profit. Billed hours per repair order were somewhat anemic for the group and the National Norm dealers. The target is two hours or more. I suspect that this may be due to not having enough service writers at peak times. This means they do not have the time to follow the proper diagnostics, walk-around and sales process necessary to capture the additional service sales.
Productivity, efficiency and proficiency numbers are much better than in prior years. This is a reflection of better service management procedures.
Overall, 2012 was a very good year for most of these dealers. I hope it was for you as well. If you haven’t already, get with your managers and establish goals for your store and the departments now. Share them with your staff and hold managers accountable. Let’s make 2013 even better!
Have questions? Feel free to contact me for information, explanation or to discuss how GSA can help you grow your business profitably.
Steve Jones, GSA senior projects manager, outlines dealerships’ best business practices to boost margins, increase profitability and retain employees. His monthly column recaps critical measurements used by the leading 20-group dealers. Access to the new Voyager 5 data reporting and analysis system is available for any dealership for nominal fee. For more information on GSA’s management workshops, data reporting system, dealer 20-groups, on-site consulting or training, send Steve an email at [email protected] or visit www.gartsutton.com.