This article contains actual numbers obtained from our 20-group data reporting and analysis system. 20-groups consist of dealers from non-competing markets who meet three times a year to share financial and best practice information. Their goal is to grow and improve their businesses profitably.
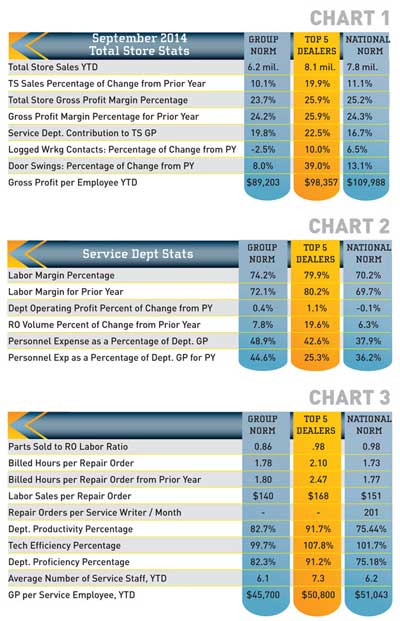 Chart 1 shows some key performance indicators for the overall store. These are provided as a point-of-reference for the department numbers. It is good to see the continuing trend of growth in total store sales. Total store gross margin is soft for the group average, and down from last year. The Top 5 and National Norm (NN) dealers are running right on the target benchmark of 25 percent.
The benchmark for service contribution to overall store gross profit (GP) is 18 percent or more. The group and Top 5 dealers are doing well, but the NN average is down.
Door swings are still trending up. GP dollars per employee looks good for the Top 5, but is trailing the NN dealer average. Keep in mind these are the Top 5 in this group, not the nation. This is one of my favorite comparables, since it is easy to calculate (total GP/total average employees) and can be used as a benchmark for any size of dealership.
In Chart 2 labor margins look very good for the group and Top 5, and the NN dealers are right on the 70 percent benchmark. Service GP is calculated by subtracting tech compensation from total labor sales. The group dealers have improved by two percent since last year,
which is actually a significant improvement. Operating profit continues to be flat across the board.
Repair Order (RO) volume is up, but so are personnel expenses – up considerably for the Top 5 dealers. As I mentioned earlier this year, I suspect this is due to changes in service advisor compensation since they have really worked to improve the functionality of this position. They have hired and trained better people in an effort to improve customer satisfaction and department profitability.
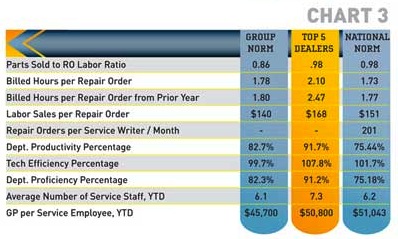
Chart 3 indicates that the parts sold to RO ratio is below the target of 1:1. Since the Service Advisor (SA) has a major influence on this number, it probably indicates that they have been covering too many ROs/month. The NN dealers are showing 201 ROs per writer, per month – way too many. Once this number gets above 175, it becomes virtually impossible for the SA to do a proper walk-around to uncover additional services and upsell appropriate services and parts. See how many average ROs per month your writers are trying to handle. You might have happier customers and make more money in service if you have more SAs who have the time to do a proper write-up.
The hours per RO is below the target of two for the group and NN dealers. The SA can’t sell the additional hours if they don’t have time to do a proper presentation.
All are showing decent efficiency – the target is 100% (hours billed divided by time-clock hours on ROs). Productivity and proficiency should be at least 75 percent, and they are all looking good, particularly the Top 5. This indicates that they are keeping their techs turning wrenches. I think productivity (actual hours on ROs divided by hours they were there to work) is the number to look at. You simply can’t afford to have techs pushing bikes and looking for units in the boneyard at $80 – $100 per hour.
As always, GP dollars per service employee is a good comparable. How is your service department doing compared with this and the other benchmarks? Look for the opportunities and make the necessary changes to fix them.
Steve Jones, GSA senior projects manager, recaps critical measurements used by the leading 20-group dealers. Access to GSA’s Voyager 5 data analysis & comparison system is available for any dealership for a nominal fee. For more information on Voyager, management workshops, dealer 20-groups, on-site consulting or training, send an email to [email protected] or visit www.gartsutton.com.