North American retail sales decreased 28% for the quarter compared to uncharacteristically strong retail sales last year, driven largely by low product availability due to supply chain constraints limiting production. On a two-year basis, retail sales were up 14% over second quarter 2019 pre-COVID levels

Second-quarter reported and adjusted sales increased 40% to $2,117 million, a second-quarter sales record
Gross profit margin reported and adjusted, for the second quarter was 26.0% and 26.1%, up 403 and 311 basis points over the prior year, respectively. The increase was primarily due to lower promotional costs and increased pricing, partially offset by increased input costs including supply chain constraints, logistic, labor and commodity prices
Market share improved during the quarter for ORV and boats
Polaris repurchased approximately 0.8 million shares of Polaris stock during the quarter for $111 million
Polaris increased its full-year 2021 earnings guidance and now expects earnings to be in the range of $9.35 to $9.60 per diluted share. Full-year 2021 adjusted sales guidance was narrowed and is now expected to be up 19% to 21% over the prior year
Key Financial Data
| (in millions, except per share data) | ||||||||||||
| INCOME STATEMENT – Q2 June 30, 2021 | Reported | YOY % Chg. | Adjusted* | YOY % Chg. | ||||||||
| Sales……………………………………………………………………………. | $ | 2,117.2 | 40% | $ | 2,117.2 | 40% | ||||||
| Net income attributable to Polaris……………………………………………………………………… | $ | 158.4 | NM | $ | 169.4 | 109% | ||||||
| Diluted EPS…………………………………………………………………….. | $ | 2.52 | NM | $ | 2.70 | 108% | ||||||
| BALANCE SHEET – June 30, 2021 | Reported | YOY % Chg. | ||||||||||
| Cash and cash equivalents………………………………………………………………………. | $ | 288.8 | (47)% | |||||||||
| Inventories, net………………………………………………………………….. | $ | 1,514.9 | 48% | |||||||||
| Total debt, finance lease obligations and notes payable………………………………………………………………….. | $ | 1,331.3 | (31)% | |||||||||
| Shareholders’ equity…………………………………………………………….. | $ | 1,120.6 | 49% | |||||||||
| CASH FLOW – YTD Q2 June 30, 2021 | Reported | YOY % Chg. | ||||||||||
| Net cash provided by operating activities………………………………………………………………………… | $ | 195.6 | (37)% | |||||||||
| Purchase of property & equipment……………………………………………………………………….. | $ | 114.4 | 30% | |||||||||
| Repurchase and retirement of common shares ………………………………………………………………………….. | $ | 410.5 | NM | |||||||||
| Cash dividends to shareholders…………………………………………………………………….. | $ | 77.0 | 1% | |||||||||
| NM= Not Meaningful *Note: the results and guidance in this release, including the highlights above, include references to non-GAAP operating measures, which are identified by the word “adjusted” preceding the measure. A reconciliation of GAAP / non-GAAP measures can be found at the end of this release. |
CEO Commentary
‘Think Outside’ is resonating with new and current customers alike with continued strong demand and second-quarter results that beat last year’s COVID-impacted quarter as anticipated. Even more notable, we delivered double-digit sales and earnings increases compared to our pre-COVID results from the second quarter and first half of 2019. All of our segments performed extremely well, posting strong increases in both sales and profitability in the face of a challenging supply chain and increasing input cost environment. While supply chain-related headwinds and higher input costs will continue into the second half of the year, the Polaris team’s operational dexterity and nimble approach has been nothing short of spectacular. I remain confident in our ability to meet the product demands of our dealers and consumers and deliver value for our shareholders.
– Mike Speetzen, Chief Executive Officer of Polaris Inc
Second Quarter Performance Summary (Reported)
| (in millions, except per share data) | Three months ended June 30, | |||||||||
| 2021 | 2020 | Change | ||||||||
| Sales…………………………………………………………………………………………. | $2,117.2 | $ | 1,511.8 | 40 | % | |||||
| Gross profit…………………………………………………………………………………. | 551.4 | 332.7 | 66 | % | ||||||
| % of Sales…………………………………………………………………………………… | 26 | % | 22 | % | +403 bpts | |||||
| Total operating expenses……………………………………………………………………………………… | 350.5 | 653.5 | (46) | % | ||||||
| % of Sales…………………………………………………………………………………… | 16.6 | % | 43.2 | % | NM | |||||
| Income from financial services………………………………………………………………………………………. | 13.7 | 25.4 | (46) | % | ||||||
| % of Sales…………………………………………………………………………………… | 0.6 | % | 1.7 | % | -103 bpts | |||||
| Operating income (loss) …………………………………………………………………………… | 214.6 | (295.4) | NM | |||||||
| % of Sales…………………………………………………………………………………… | 10.1 | % | (19.5) | % | NM | |||||
| Net income (loss) attributable to Polaris…………………………………………………………………………………… | 158.4 | (235.4) | NM | |||||||
| % of Sales…………………………………………………………………………………… | 7.5 | % | (15.6) | % | NM | |||||
| Diluted net income (loss) per share…………………………………………………………………………………… | $ 2.52 | $ (3.82) | NM | |||||||
| NM= Not Meaningful |
Polaris Inc. (NYSE: PII) has released its second-quarter 2021 results with reported sales of $2,117 million, up 40 percent from reported sales of $1,512 million for the second quarter of 2020. The Company reported second-quarter 2021 net income of $158 million, or $2.52 per diluted share, compared with a net loss of $235 million, or $(3.82) per diluted share, for the 2020 second quarter. The 2020 second-quarter net loss includes a $379 million pre-tax, non-cash goodwill and other intangible asset impairment charge related to the Company’s Aftermarket business, principally Transamerican Auto Parts (TAP). Adjusted net income for the quarter ended June 30, 2021, was $169 million, or $2.70 per diluted share compared to $81 million, or $1.30 per diluted share in the 2020 second quarter.
Ongoing robust retail demand requiring little or no promotional assistance, along with favorable product mix and pricing continued to drive improvements in the Company’s performance.
Gross profit increased 66 percent to $551 million for the second quarter of 2021 from $333 million in the second quarter of 2020. Reported gross profit margin was 26.0 percent of sales for the second quarter of 2021, up 403 basis points compared to 22.0 percent of sales for the second quarter of 2020. The improvement in gross profit was driven primarily by higher volumes, lower promotional costs, favorable pricing and improved product mix during the quarter, partially offset by higher input costs including logistical costs, component costs and plant inefficiencies related to the supply-chain constraints and higher commodity prices. Adjusted gross profit for the second quarter 2021 was $553 million, or 26.1 percent of adjusted sales compared to the second quarter of 2020 adjusted gross profit of $348 million, or 23.0 percent of sales. Adjusted gross profit for the second quarter of 2021 and 2020 excludes the negative impact of $2 million and $15 million of restructuring and realignment costs, respectively.
Operating expenses decreased 46 percent for the second quarter of 2021 to $351 million from $654 million in the same period in 2020. Operating expenses decreased primarily due to the prior year non-cash impairment of goodwill and other intangible assets associated with the Company’s Aftermarket segment, partially offset by an increase in total operating expenses to levels commensurate with the improvement in demand.
Income from financial services was $14 million for the second quarter of 2021, down 46 percent compared with $25 million for the second quarter of 2020. The decrease was due to lower retail financing income resulting from lower retail sales and lower penetration rates at our retail financing providers and a decrease in wholesale financing income due to lower dealer inventory levels.
Non-Operating Expenses (Reported)
| (in millions) | Three months ended June 30, | |||||||||
| 2021 | 2020 | Change | ||||||||
| Interest expense | $ | 10.7 | $ | 17.9 | (40) | % | ||||
| Other (income) expense, net | $ | (3.2) | $ | (0.8 | ) | NM | ||||
| Provision for income taxes | $ | 48.6 | $ | (78.7) | NM | |||||
| NM= Not Meaningful |
Interest expense was $11 million for the second quarter of 2021 compared to $18 million for the same period last year primarily due to lower debt levels.
Other (income) expense, net, was $3 million of income in the second quarter of 2021 compared to $1 million of expense in the second quarter of 2020. Other (income) expense is the result of currency exchange rate movements and the corresponding effects on currency transactions related to the Company’s international subsidiaries.
The provision for income taxes for the second quarter of 2021 was $49 million, or 23.4 percent of pretax income, compared with a tax benefit of $79 million, or 25.0 percent of pretax loss, for the second quarter of 2020. The decrease in the effective income tax rate is primarily due to favorable excess tax benefits related to share-based compensation on pretax income during 2021 as compared to the impact of deferred tax benefits arising from the significant pretax loss from the impairment of goodwill and other intangible assets in 2020, as well as the release of certain income tax reserves during 2020.
Product Segment Highlights (Reported)
| (in millions) | Sales | Gross Profit | |||||||||||||||||||
| Q2 2021 | Q2 2020 | Change | Q2 2021 | Q2 2020 | Change | ||||||||||||||||
| Off-Road Vehicles / Snowmobiles | $ | 1,314.3 | $ | 952.9 | 38 | % | $ | 364.6 | $ | 251.7 | 45 | % | |||||||||
| Motorcycles | $ | 211.7 | $ | 141.3 | 50 | % | $ | 23.9 | $ | 4.4 | NM | ||||||||||
| Global Adjacent Markets | $ | 154.1 | $ | 77.9 | 98 | % | $ | 41.7 | $ | 16.8 | 148 | % | |||||||||
| Aftermarket | $ | 239.5 | $ | 207.5 | 15 | % | $ | 62.8 | $ | 47.6 | 32 | % | |||||||||
| Boats | $ | 197.6 | $ | 132.2 | 49 | % | $ | 47.4 | $ | 18.6 | 155 | % | |||||||||
| NM= Not Meaningful |
Off-Road Vehicles (ORV) and Snowmobiles segment sales, including PG&A, totaled $1,314 million for the second quarter of 2021, up 38 percent compared to $953 million for the second quarter of 2020 driven by broad-based strength across ATVs, Side-by-Sides and Snowmobile sales. PG&A sales for ORV and Snowmobiles combined increased 31 percent in the second quarter of 2021 compared to the second quarter last year. Gross profit increased 45 percent to $365 million in the second quarter of 2021, compared to $252 million in the second quarter of 2020. Gross profit percentage increased 132 basis points during the 2021 second quarter compared to the prior year due to robust demand and historically low dealer inventories, which supported lower promotional and floor-plan finance spending, partially offset by higher input costs related to supply chain constraints.
ORV wholegood sales for the second quarter of 2021 increased 38 percent. Polaris North American ORV retail sales decreased low-thirties percent for the quarter with side-by-side vehicles down low-thirties percent and ATV vehicles down high-twenties percent. The North American ORV industry was down mid-thirties percent compared to the second quarter last year.
Snowmobile wholegood sales in the second quarter of 2021 were $32 million compared to $12 million in the second quarter last year. Snowmobile sales in the Company’s second quarter are routinely low as it is the off-season for snowmobile shipments.
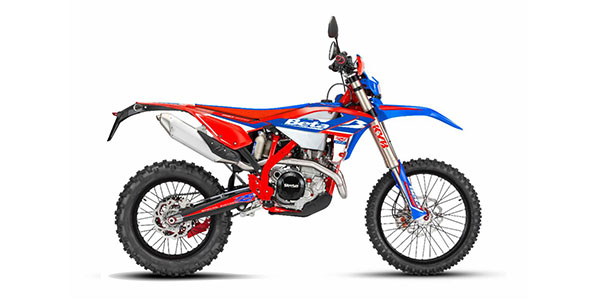
Motorcycles segment sales, including PG&A, totaled $212 million, up 50 percent compared to the second quarter of 2020, driven by increased sales of Slingshot, Indian Motorcycles, and related PG&A. Gross profit for the second quarter of 2021 was $24 million compared to $4 million in the second quarter of 2020. The increase in gross profit margin was driven by increased volume and lower promotional costs, partially offset by increased input costs from supply chain constraints.
North American consumer retail sales for Indian Motorcycles increased high-twenties percent during the second quarter of 2021 in a mid-to-heavy-weight two-wheel motorcycle industry that was up mid-thirties percent. North American consumer retail sales for Polaris’ motorcycle segment, including both Indian Motorcycle and Slingshot, increased low-twenties percent during the second quarter of 2021. North American consumer retail sales for the motorcycle industry including both two-wheel and three-wheel increased mid-thirties percent during the second quarter of 2021. Indian and Slingshot market share losses were driven by a lack of product availability during the quarter driven by supply-chain challenges.
Global Adjacent Markets segment sales, including PG&A, increased 98 percent to $154 million in the 2021 second quarter compared to $78 million in the 2020 second quarter driven by increases in demand in North America and EMEA. Gross profit increased 148 percent to $42 million or 27.1 percent of sales in the second quarter of 2021, compared to $17 million or 21.4 percent of sales in the second quarter of 2020. Gross profit percentage increased during the quarter primarily due to increased volume with lower promotional costs, favorable foreign exchange rates and increased pricing, offset somewhat by higher input costs related to supply chain constraints.
Aftermarket segment sales of $240 million in the 2021 second quarter increased 15 percent compared to $208 million in the 2020 second quarter. Transamerican Auto Parts (TAP) sales of $206 million in the second quarter of 2021 increased nine percent compared to $189 million in the second quarter of 2020. The Company’s other aftermarket brands sales were up 80 percent compared to the second quarter of 2020. Gross profit increased 32 percent to $63 million or 26.2 percent of sales in the second quarter of 2021, compared to $48 million or 22.9 percent of sales in the second quarter of 2020. Gross profit percentage improved during the quarter due to higher volume and increased pricing.
Boats segment sales increased 49 percent to $198 million in the 2021 second quarter compared to $132 million in the 2020 second quarter, driven by sales growth in all three brands, Bennington, Godfrey and Hurricane. Gross profit increased 155 percent to $47 million or 24.0 percent of sales in the second quarter of 2021, compared to $19 million or 14.1 percent of sales in the second quarter of 2020 due to increased volume and positive product mix partially offset by increased input costs related to supply chain constraints.
Supplement Segmental Data:
- Parts, Garments, and Accessories (PG&A) sales increased 35 percent for the 2021 second quarter with all categories and business segments growing sales during the quarter.
- International sales to customers outside of North America, including PG&A, totaled $311 million for the second quarter of 2021, up 64 percent from the same period in 2020. All regions realized significant sales increases year over year.
Financial Position and Cash Flow
| (in millions) | Six months ended June 30, | |||||||||
| 2021 | 2020 | Change | ||||||||
| Cash and cash equivalents | $ | 288.8 | $ | 544.4 | (47) | % | ||||
| Net cash provided by operating activities | $ | 195.6 | $ | 309.7 | (37) | % | ||||
| Repurchase and retirement of common shares | $ | 410.5 | $ | 49.3 | NM | |||||
| Cash dividends to shareholders | $ | 77.0 | $ | 76.0 | 1 | % | ||||
| Total debt, finance lease obligations and notes payable | $ | 1,331.3 | $ | 1,928.0 | (31) | % | ||||
| Debt to Total Capital Ratio | 54 | % | 72 | % | ||||||
| NM= Not Meaningful |
2021 Business Outlook
Given the 2021 first half results, and the expected continued solid retail demand and current dealer pre-order sales from consumers, the Company is increasing its full-year earnings guidance and now expects adjusted net income to be in the range of $9.35 to $9.60 per diluted share, compared with adjusted net income of $7.74 per diluted share for 2020. Full-year 2021 sales guidance was narrowed and is now expected to be in the range of $8,375 to $8,500 million, up 19 to 21 percent.
Non-GAAP Financial Measures
This press release and our related earnings call contain certain non-GAAP financial measures, consisting of “adjusted” sales, gross profit, income before taxes, net income and net income per diluted share as measures of our operating performance. Management believes these measures may be useful in performing meaningful comparisons of past and present operating results, to understand the performance of its ongoing operations and how management views the business. Reconciliations of reported GAAP measures to adjusted non-GAAP measures are included in the financial schedules contained in this press release. These measures, however, should not be construed as an alternative to any other measure of performance determined in accordance with GAAP.
Earnings Conference Call and Webcast
Today at 9:00 AM (CT) Polaris Inc. will host a conference call and webcast to discuss the 2021 second-quarter results released this morning. The call will be hosted by Mike Speetzen, CEO; and Bob Mack, CFO The earnings presentation and link to the webcast will be posted on the Polaris Investor Relations website at ir.polaris.com. To listen to the conference call by phone, dial 1-877-883-0383 in the U.S., or 1-412-902-6506 internationally. The Conference ID is 1811884. A replay of the conference call will be available by accessing the same link on our website.
Source: www.polaris.com
(summarized financial data follows)
| CONSOLIDATED STATEMENTS OF INCOME (LOSS)(In Millions, Except Per Share Data)(Unaudited) | |||||||||||||||
| Three months ended June 30, | Six months ended June 30, | ||||||||||||||
| 2021 | 2020 | 2021 | 2020 | ||||||||||||
| Sales………………………………………………………….. | $ | 2,117.2 | $ | 1,511.8 | $ | 4,068.3 | $ | 2,917.0 | |||||||
| Cost of sales………………………………………………….. | 1,565.8 | 1,179.1 | 3,036.4 | 2,291.4 | |||||||||||
| Gross profit……………………………………………………. | 551.4 | 332.7 | 1,031.9 | 625.6 | |||||||||||
| Operating expenses: | |||||||||||||||
| Selling and marketing……………………………………… | 154.2 | 119.6 | 300.1 | 269.8 | |||||||||||
| Research and development…………………………………. | 88.8 | 66.8 | 168.3 | 145.2 | |||||||||||
| General and administrative………………………………….. | 107.5 | 87.9 | 194.6 | 166.4 | |||||||||||
| Goodwill and other intangible asset impairments…………………. | — | 379.2 | — | 379.2 | |||||||||||
| Total operating expenses………………………………………. | 350.5 | 653.5 | 663.0 | 960.6 | |||||||||||
| Income from financial services………………………………… | 13.7 | 25.4 | 29.9 | 45.1 | |||||||||||
| Operating income (loss)……………………………………………… | 214.6 | (295.4) | 398.8 | (289.9) | |||||||||||
| Non-operating expense: | |||||||||||||||
| Interest expense……………………………………………. | 10.7 | 17.9 | 22.2 | 34.1 | |||||||||||
| Other expense (income), net………………………………. | (3.2) | 0.8 | (5.7) | (1.7) | |||||||||||
| Income (loss) before income taxes………………………………….. | 207.1 | (314.1) | 382.3 | (325.7) | |||||||||||
| Provision for income taxes……………………………………. | 48.6) | (78.7) | 89.6 | (84.9) | |||||||||||
| Net income (loss)…………………………………………………… | 158.5 | (235.4) | 292.7 | (240.8) | |||||||||||
| Net (income) loss attributable to noncontrolling interest | (0.1) | — | (0.2) | — | |||||||||||
| Net income (loss) attributable to Polaris Inc. | $158.4 | $(235.4) | $292.5 | $(240.8) | |||||||||||
| Net income (loss) per share attributable to Polaris Inc. common shareholders: | |||||||||||||||
| Basic………………………………………………………. | $ | 2.58 | $ | (3.82) | $ | 4.75 | $ | (3.90) | |||||||
| Diluted……………………………………………………… | $ | 2.52 | $ | (3.82) | $ | 4.63 | $ | (3.90) | |||||||
| Weighted average shares outstanding: | |||||||||||||||
| Basic………………………………………………………… | 61.3 | 61.6 | 61.6 | 61.7 | |||||||||||
| Diluted……………………………………………………….. | 62.8 | 61.6 | 63.1 | 61.7 |
| CONSOLIDATED BALANCE SHEETS | |||||||
| (In Millions), (Unaudited) | |||||||
| June 30, 2021 | June 30, 2020 | ||||||
| Assets | |||||||
| Current Assets: | |||||||
| Cash and cash equivalents………………………………………………………………….. | $ | 288.8 | $ | 544.4 | |||
| Trade receivables, net…………………………………………………………………………… | 220.3 | 195.2 | |||||
| Inventories, net………………………………………………………………………………….. | 1,514.9 | 1,026.4 | |||||
| Prepaid expenses and other………………………………………………………………….. | 109.1 | 103.5 | |||||
| Income taxes receivable……………………………………………………………………….. | 0.3 | 14.2 | |||||
| Total current assets……………………………………………………………………………………… | 2,133.4 | 1,883.7 | |||||
| Property and equipment, net………………………………………………………………………….. | 900.4 | 873.7 | |||||
| Investment in finance affiliate………………………………………………………………………… | 29.3 | 72.0 | |||||
| Deferred tax assets……………………………………………………………………………………….. | 159.2 | 184.7 | |||||
| Goodwill and other intangible assets, net………………………………………………………………………………………………………. | 1,063.9 | 1,092.0 | |||||
| Operating lease assets………………………………………………………………………………………………………. | 123.9 | 105.4 | |||||
| Other long-term assets………………………………………………………………………………… | 115.1 | 101.2 | |||||
| Total assets……………………………………………………………………………………………. | $ | 4,525.2 | $ | 4,312.7 | |||
| Liabilities and Equity………………………………………………………………… | |||||||
| Current Liabilities: | |||||||
| Current portion of debt, finance lease obligations and notes payable………………………………………………………………………………………….. | $ | 53.1 | $ | 536.5 | |||
| Accounts payable………………………………………………………………………………… | 899.3 | 545.6 | |||||
| Accrued expenses: | |||||||
| Compensation……………………………………………………………………………….. | 211.4 | 127.1 | |||||
| Warranties…………………………………………………………………………………… | 142.2 | 134.2 | |||||
| Sales promotions and incentives……………………………………………………… | 59.7 | 132.6 | |||||
| Dealer holdback…………………………………………………………………………… | 97.4 | 138.6 | |||||
| Other……………………………………………………………………………………….. | 288.4 | 249.8 | |||||
| Current operating lease liabilities ……………………………………………………………… | 35.4 | 35.3 | |||||
| Income taxes payable …………………………………………………………………………. | 35.2 | 7.9 | |||||
| Total current liabilities………………………………………………………………………………….. | 1,822.1 | 1,907.6 | |||||
| Long term income taxes payable…………………………………………………………………….. | 16.1 | 20.0 | |||||
| Finance lease obligations…………………………………………………………………………………. | 13.4 | 14.2 | |||||
| Long-term debt…………………………………………………………………………………………….. | 1,264.8 | 1,377.3 | |||||
| Deferred tax liabilities…………………………………………………………………………………….. | 4.3 | 3.3 | |||||
| Long-term operating lease liabilities…………………………………………………………………………………….. | 90.9 | 72.4 | |||||
| Other long-term liabilities……………………………………………………………………………….. | 179.4 | 150.5 | |||||
| Total liabilities……………………………………………………………………………………………….. | $ | 3,391.0 | $ | 3,545.3 | |||
| Deferred compensation…………………………………………………………………………………. | 11.9 | 14.2 | |||||
| Equity: | |||||||
| Total shareholders’ equity………………………………………………………………………………. | 1,120.6 | 753.0 | |||||
| Noncontrolling interest………………………………………………………………………………. | 1.7 | 0.2 | |||||
| Total equity……………………………………………………………………………………………. | 1,122.3 | 753.2 | |||||
| Total liabilities and shareholders’ equity……………………………………………………………. | $ | 4,525.2 | $ | 4,312.7 |
| CONSOLIDATED STATEMENTS OF CASH FLOWS(In Millions), (Unaudited) | |||||||
| Six months ended June 30, | |||||||
| 2021 | 2020 | ||||||
| Operating Activities: | |||||||
| Net income (loss) | $ | 292.7 | $ | (240.8) | |||
| Adjustments to reconcile net income (loss) to net cash used for operating activities | |||||||
| Depreciation and amortization | 118.3 | 127.1 | |||||
| Noncash compensation | 25.2 | 31.7 | |||||
| Noncash income from financial services | (4.3) | (11.9) | |||||
| Deferred income taxes | 18.7 | (92.6) | |||||
| Goodwill and other intangible asset impairments | — | 379.2 | |||||
| Changes in operating assets and liabilities: | |||||||
| Trade receivables | 33.7 | (6.2) | |||||
| Inventories | (341.3) | 91.8 | |||||
| Accounts payable | 119.5 | 95.3 | |||||
| Accrued expenses | (92.2) | (77.8) | |||||
| Income taxes payable/receivable | 18.8 | 12.0 | |||||
| Prepaid expenses and others, net | 6.5 | 1.9 | |||||
| Net cash used for operating activities | 195.6 | 309.7 | |||||
| Investing Activities: | |||||||
| Purchase of property and equipment | (114.4) | (88.1) | |||||
| Investment in finance affiliate, net | 34.3 | 50.6 | |||||
| Net cash used for investing activities | (80.1) | (37.5) | |||||
| Financing Activities: | |||||||
| Borrowings under debt arrangements / financial lease obligations | 499.9 | 1,288.9 | |||||
| Repayments under debt arrangements / financial lease obligations | (619.0) | (1,054.9) | |||||
| Repurchase and retirement of common shares | (410.5) | (49.3) | |||||
| Cash dividends to shareholders | (77.0) | (76.0) | |||||
| Proceeds from stock issuances under employee plans | 146.1 | 6.9 | |||||
| Net cash provided by (used for) financing activities | (460.5) | 115.4 | |||||
| Impact of currency exchange rates on cash balances | (1.9) | (3.1) | |||||
| Net increase (decrease) in cash, cash equivalents and restricted cash | (346.9) | 384.5 | |||||
| Cash, cash equivalents and restricted cash at beginning of period | 657.5 | 196.3 | |||||
| Cash, cash equivalents and restricted cash at end of period | $ | 310.6 | $ | 580.8 | |||
| The following presents the classification of cash, cash equivalents and restricted cash within the consolidated balance sheets: | |||||||
| Cash and cash equivalents | $ | 288.8 | $ | 544.4 | |||
| Other long-term assets | 21.8 | 36.4 | |||||
| Total | $ | 310.6 | $ | 580.5 |
| NON-GAAP RECONCILIATION OF RESULTS | |||||||||||||||
| (In Millions, Except Per Share Data), (Unaudited) | |||||||||||||||
| Three months ended June 30, | Six months ended June 30, | ||||||||||||||
| 2021 | 2020 | 2021 | 2020 | ||||||||||||
| Sales | $ | 2,117.2 | $ | 1,511.8 | $ | 4,068.3 | $ | 2,917.0 | |||||||
| Restructuring & realignment (3) | — | (1.7) | — | (1.7) | |||||||||||
| Adjusted sales | 2,117.2 | 1,510.1 | 4,068.3 | 2,915.3 | |||||||||||
| Gross profit | 551.4 | 332.7 | 1,031.9 | 625.6 | |||||||||||
| Restructuring & realignment (3) | 1.7 | 14.8 | 3.9 | 20.1 | |||||||||||
| Adjusted gross profit | 553.1 | 347.5 | 1,035.8 | 645.7 | |||||||||||
| Income (loss) before taxes | 207.1 | (314.1) | 382.3 | (325.7) | |||||||||||
| Impairment charges (1) | — | 379.2 | — | 379.2 | |||||||||||
| Restructuring & realignment (2) | 1.7 | 22.9 | 3.9 | 34.7 | |||||||||||
| Intangible amortization (3) | 8.5 | 8.7 | 17.2 | 18.7 | |||||||||||
| Class action litigation expenses (4) | 4.2 | 4.4 | 8.4 | 7.6 | |||||||||||
| Adjusted income before taxes | 221.5 | 101.1 | 411.8 | 114.5 | |||||||||||
| Net income (loss) attributable to Polaris Inc. | 158.4 | (235.4) | 292.5 | (240.8) | |||||||||||
| Impairment charges (1) | — | 289.0 | — | 289.0 | |||||||||||
| Restructuring & realignment (2) | 1.3 | 17.5 | 3.0 | 26.5 | |||||||||||
| Intangible amortization (3) | 6.5 | 6.6 | 13.1 | 14.1 | |||||||||||
| Class action litigation expenses (4) | 3.2 | 3.2 | 6.4 | 5.7 | |||||||||||
| Adjusted net income attributable to Polaris Inc. (5) | 169.4 | 80.9 | 315.0 | 94.5 | |||||||||||
| Diluted EPS attributable to Polaris Inc. | $ | 2.52 | $ | (3.82) | $ | 4.63 | $ | (3.90) | |||||||
| Weighted average shares outstanding adjustment (6) | — | 0.02 | — | 0.03 | |||||||||||
| Impairment charges (1) | — | 4.66 | — | 4.64 | |||||||||||
| Restructuring & realignment (2) | 0.02 | 0.28 | 0.05 | 0.43 | |||||||||||
| Intangible amortization (3) | 0.11 | 0.11 | 0.21 | 0.23 | |||||||||||
| Class action litigation expenses(4) | 0.05 | 0.05 | 0.10 | 0.09 | |||||||||||
| Adjusted EPS attributable to Polaris Inc. (5) | $ | 2.70 | $ | 1.30 | $ | 4.99 | $ | 1.52 | |||||||
| (1) Represents impairment charges related to goodwill and other intangible assets associated with the Company’s Aftermarket segment | |||||||||||||||
| (2) Represents adjustments for corporate restructuring, network realignment costs, and supply chain transformation | |||||||||||||||
| (3) Represents amortization expense for acquisition-related intangible assets | |||||||||||||||
| (4) Represents adjustments for class action litigation-related expenses | |||||||||||||||
| (5) The Company used its estimated statutory tax rate of 23.8% for the non-GAAP adjustments in 2021 and 2020, except for non-deductible items | |||||||||||||||
| (6) For the three months ended June 30, 2020, the Company used 61.6 million and 62.1 million weighted average shares outstanding to determine Diluted EPS attributable to Polaris Inc. and Adjusted EPS attributable to Polaris Inc., respectively, and for the six months ended June 30, 2020, the Company used 61.7 million and 62.3 million weighted average shares outstanding to determine Diluted EPS attributable to Polaris Inc. and Adjusted EPS attributable to Polaris Inc., respectively. The differences are the result of the exclusion of additional outstanding stock options and certain shares issued under the Omnibus Plan from the Diluted EPS attributable to Polaris Inc. calculation because their effect would have been anti-dilutive as a result of the Company’s net loss during the periods. | |||||||||||||||
| NON-GAAP RECONCILIATION OF SEGMENT RESULTS | |||||||||||||||
| (In Millions), (Unaudited) | |||||||||||||||
| Three months ended June 30, | Six months ended June 30, | ||||||||||||||
| SEGMENT SALES | 2021 | 2020 | 2021 | 2020 | |||||||||||
| ORV/Snow segment sales | $ | 1,314.3 | $ | 952.9 | $ | 2,546.5 | $ | 1,776.6 | |||||||
| No adjustment | — | — | — | — | |||||||||||
| Adjusted ORV/Snow segment sales | 1,314.3 | 952.9 | 2,546.5 | 1,776.6 | |||||||||||
| Motorcycles segment sales | 211.7 | 141.3 | 377.3 | 267.9 | |||||||||||
| No adjustment | — | — | — | — | |||||||||||
| Adjusted Motorcycles segment sales | 154.1 | 77.9 | 278.9 | 176.2 | |||||||||||
| Global Adjacent Markets (GAM) segment sales | 154.1 | 77.9 | 278.9 | 176.2 | |||||||||||
| No adjustment | — | — | — | — | |||||||||||
| Adjusted GAM segment sales | 154.1 | 77.9 | 278.9 | 176.2 | |||||||||||
| Aftermarket segment sales | 239.5 | 207.5 | 469.3 | 409.6 | |||||||||||
| No adjustment | — | — | — | — | |||||||||||
| Adjusted Aftermarket sales | 239.5 | 207.5 | 469.3 | 409.6 | |||||||||||
| Boats segment sales | 197.6 | 132.2 | 396.3 | 286.7 | |||||||||||
| Restructuring & realignment(1) | — | (1.7) | — | (1.7) | |||||||||||
| Boats segment sales | 197.6 | 130.5 | 396.3 | 285.0 | |||||||||||
| Total sales | 2,117.2 | 1,511.8 | 4,068.3 | 2,917.0 | |||||||||||
| Total adjustments | — | (1.7) | — | (1.7) | |||||||||||
| Adjusted total sales | $ | 2,117.2 | $ | 1,510.1 | $ | 4,068.3 | $ | 2,917.0 | |||||||
| Three months ended June 30, | Six months ended June 30, | ||||||||||||||
| SEGMENT GROSS PROFIT | 2021 | 2020 | 2021 | 2020 | |||||||||||
| ORV/Snow segment gross profit | $ | 364.6 | $ | 251.7 | $ | 692.0 | $ | 453.4 | |||||||
| No adjustment | — | — | — | — | |||||||||||
| Adjusted ORV/Snow segment gross profit | 364.6 | 251.7 | 692.0 | 453.4 | |||||||||||
| Motorcycles segment gross profit | 23.9 | 4.4 | 31.9 | 4.1 | |||||||||||
| Restructuring & realignment (1) | — | — | 0.7 | — | |||||||||||
| Adjusted Motorcycles segment gross profit | 23.9 | 4.4 | 31.9 | 4.1 | |||||||||||
| Global Adjacent Markets (GAM) segment gross profit | 41.7 | 16.8 | 74.6 | 43.7 | |||||||||||
| No adjustment | — | — | — | — | |||||||||||
| Adjusted GAM segment gross profit | 41.7 | 16.8 | 74.6 | 43.7 | |||||||||||
| Aftermarket segment gross profit | 62.8 | 47.6 | 124.1 | 93.9 | |||||||||||
| No adjustment | — | — | — | — | |||||||||||
| Adjusted Aftermarket segment gross profit | 62.8 | 47.6 | 124.1 | 93.9 | |||||||||||
| Boats segment gross profit | 47.4 | 18.6 | 93.8 | 48.3 | |||||||||||
| Restructuring & realignment (1) | — | 11.1 | — | 11.1 | |||||||||||
| Boats segment gross profit | 47.4 | 29.7 | 93.8 | 59.4 | |||||||||||
| Corporate segment gross profit | 11.0 | (6.4) | 15.5 | (17.1) | |||||||||||
| Restructuring & realignment (1) | 1.7 | 3.7 | 3.9 | 8.3 | |||||||||||
| Adjusted Corporate segment gross profit | 12.7 | (2.7) | 19.4 | (8.8) | |||||||||||
| Total gross profit | 551.4 | 332.7 | 1,031.9 | 625.6 | |||||||||||
| Total adjustmentsn | 1.7 | 14.8 | 3.9 | 20.1 | |||||||||||
| Adjusted total gross profit | $ | 553.1 | $ | 347.5 | $ | 1,035.8 | $ | 645.7 | |||||||
(1) Represents adjustments for corporate restructuring, network realignment costs, and supply chain transformation
NON-GAAP ADJUSTMENTS
Second Quarter 2021 Results & Full Year Guidance
Restructuring, Realignment and Acquisition Related Costs
Polaris announced in 2017 that it was making changes to its network to consolidate production and distribution of like products and better leverage plant capacity and embarked on a multi-phase supply chain transformation initiative to continue to leverage its supply chain as a strategic asset. The Company is also executing certain corporate restructuring across the organization to increase efficiency and focus its business including the wind-down of the Rinker, Striper and Larson FX boat brands. For the second quarter of 2021, the Company has recorded combined costs totaling $2 million which was included as a NON-GAAP adjustment.
Intangible amortization related to acquisitions
The Company uses an adjusted net income metric which excludes intangible amortization from all historical business acquisitions. The Company believes this NON-GAAP information is useful to understanding its operating results and the ongoing performance of its underlying businesses because the amount and timing of such charges are significantly impacted by the timing, size, number and nature of the acquisitions the Company completes. For the second quarter of 2021, Polaris recorded $9 million of intangible amortization related to acquisitions as a NON-GAAP adjustment.