 We have decided to head in a slightly different direction with this column. For some time, these columns have contained a short analysis of selected data from the entire dealership operation. The next few articles will highlight a particular department. While these will still feature actual dealer numbers, the column will focus more on best industry practices and key performance indicators (KPIs).
This month, we will take a closer look at service department operations. Service has been a tough area for most dealers when it comes to making a profit. Sometimes, it’s like herding cats — it seems to have a mind of its own and doesn’t always respond well to direction. Some dealers think of it as a “necessary evil” and want to farm it out to someone else. Other dealers swear it’s impossible to make a profit in this department.
However, statistics and surveys prove that service is a key ingredient to growing your sales operation and retaining your existing customers. In fact, the last customer survey I read reported that the service department was the No. 1 reason customers either did or did not buy again from the same dealership. When you take into account the average customer buys around seven units during their powersports life-cycle, this is huge. It’s a whole lot more cost-effective to retain your existing customer than it is to capture a new one.
This also creates a somewhat intangible asset value for the service department. While it may not look terribly profitable (if at all) on the surface, how much would it cost you in lost unit sales, F&I sales and P&A sales if it wasn’t there to support your customers?
Before we get into the numbers, we need to clarify some of the definitions for terms we will be using throughout the article:
Service revenue: Service only sells labor hours. Oh, sure, they help sell parts and accessories. However, for tracking purposes, these sales belong to the P&A department, not the service department. If there are spiffs paid to service for P&A sales, they should come from the P&A department. That’s who benefits from the profits.
Gross profit (GP): GP is calculated by sales revenue less cost of sales. This is a little tricky for the service department because the only product service sells is labor. Therefore, the cost of sales is only tech compensation (not including benefits) plus any sublet labor. The goal here is 70 percent GP. Therefore, the “bucket” you have for paying your techs should be under 30 percent of the department’s revenue.
Effective labor rate: This represents labor sales divided by all of the man-hours for the service department (tech hours + support hours + service advisor hours + service manager hours).
Available hours: These are the hours the tech is available to work. I prefer using the hours they were scheduled, rather than the clocked time they showed up. You have to build your department budget based on projections of scheduled hours. If they aren’t there the hours that I need, I want that reflected in the measurements.
Actual hours: These are the actual hours techs clocked in and out on ROs. If you don’t use a time clock, you will never get accurate measurements. You can forget about tracking your service department’s performance. Time clocks are not optional.
Billed hours: These are the hours billed on internal, warranty and customer-paid ROs. You must have a policy of accurately billing the dealership for internal hours. A tech should never do anything in the service department without an RO that bills someone for that time.
Efficiency: This is a measurement of the technician’s performance. The calculation is billed hours divided by actual hours. The benchmark is at least 100 percent. Techs that can beat flat rate will exceed 100 percent.
Productivity: Among other things, this measures the service manager’s ability to keep work flowing smoothly through the service department. The formula is actual hours divided by available hours. The benchmark is 85 percent.
Proficiency: This provides an overall look at the operation. Some call it the profitability measurement. The formula is billed hours divided by available hours. The target is 85 percent.
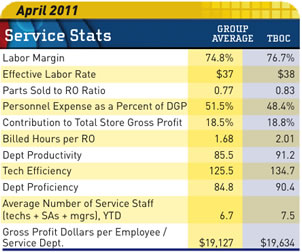
Based on the chart, this group is showing stellar performance in many areas. In particular, the exceptional labor margin (aka GP) and the high three key indicators — efficiency, productivity and proficiency — show that they are getting a lot of results from their service investment. These kinds of numbers are only attainable if you have the highly qualified, well-trained and motivated people — from the service manager on down. This has to be combined with structured written processes to provide consistency and accountability.
The parts sold to labor ratio seems a bit low, as the benchmark is considered to be 1:1. The Contribution to total store GP is very good, however. The target for billed hours per RO is two or more, and they are right there.
The measurement of GP dollars per employee is an interesting one. You should try this for all of your departments. In coming months, I will provide you with benchmarks for the other departments. This can be a real strong indicator of whether you are overstaffed or understaffed.
Note: There are different definitions for productivity and proficiency. We are using what is considered “industry standard.” That doesn’t make their definitions wrong, just different. As long as they provide formulas and benchmarks, they can work just as well.
Steve Jones, GSA senior projects manager, outlines dealership best business practices to boost margins, increase profitability and retain employees. His monthly column recaps critical measurements used by the leading 20-group dealers. GSA is recognized as the industry’s #1 authority on dealer profitability.
Access to the new Voyager 5 data reporting and analysis system is available for any dealership for nominal fee.
For more information on GSA’s data reporting system, dealer 20-groups, on-site consulting or training, email [email protected] or visit www.gartsutton.com.