 In this month’s installment, we will compare a select metric dealer 20-group with the metric National Norm numbers (overall averages for all our metric 20-groups).
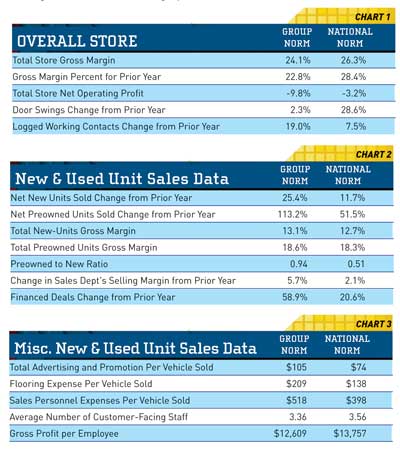
In Chart 1 we see some overall store data. This helps set the stage to discuss the sales department’s performance for January. You can see that this group has increased the total store gross profit. However, they remain below the benchmark target of 25 percent. Meanwhile, the National Norm number dropped a bit, but it is still well above 25 percent. Even with that, they’re showing a negative net profit (but not as bad as the group number). This is quite possibly the result of increasing expenses due to the ramping up of staff for the coming selling season.
Door swings are up for January — quite a bit for the National Norms. This could be due to non-typical warmer weather in much of the country. Interestingly, the group norm shows a significant increase in logged contacts. This might indicate a renewed focus on training and enforcement by the group members to improve their capture of customer information.
Chart 2 reveals significant increases in new and preowned sales. Again, the large increase in the group norm indicates they are putting forth more effort in this area. The new unit margins are fair. Preowned is better, but below a lot of the dealers who are holding over 20 percent in preowned. This could indicate they are clearing out some inventory. Even with that, they are showing a good increase in overall sales margin over last January.
Preowned to new ratios have come up a lot with this group, averaging nearly 1:1. The National Norm is showing roughly two new units sold to every one used. This is much, much better than what we saw over the last six to eight years. Dealers are becoming very conscious of the value of focusing on preowned.
I like the per vehicle sold comparisons you see in Chart 3. They are valid comparisons for any dealer of any size. The number of customer-facing staff gives some indication of average dealership size. The gross profit per employee is another number that any size of dealership can use for comparison.
I hope you have set your goals for this year, and that you will use the data in these articles to compare the performance of your dealership as you move forward. Best wishes for great sales and profits for 2012!
The goal for these articles is to get you thinking about the performance you could be achieving.
Steve Jones, GSA senior projects manager, outlines dealership best business practices to boost margins, increase profitability and retain employees. His monthly column recaps critical measurements used by the leading 20-group dealers. GSA is recognized as the industry’s #1 authority on dealer profitability. Access to the new Voyager 5 data reporting and analysis system is available for any dealership for nominal fee. For more information on GSA’s data reporting system, dealer 20-groups, on-site consulting or training, email [email protected] or visit www.gartsutton.com.