At GSA we track benchmarks through our involvement with dealer groups, such as the Best Operators Clubs. Some of the members have kindly consented to let us share their numbers from our real-time, web-based data reporting system.
We are struggling through one of the worst times the industry has experienced. Do you wonder if your dealership’s situation is typical compared with other dealers? I thought you might be interested in seeing what has happened to the BOC-1 group during the last three years. This month we are going to look at their April 2009 data compared with April of 2007 and 2008.
Chart 1 shows that gross profit was up slightly in ’08, however, 2009 numbers now match ’07 numbers. Most significant is the drop in net from +2.5 percent in 2007 to -3.4 percent today. Look at the bottom line in the chart. Overall revenue in 2008 was down 12.5 percent and has dropped an additional 27 percent for 2009. This resulted in increasing expenses relative to revenue, even after these dealers have scrambled to cut back without losing critical staff or moving to smaller facilities. This is a critical dance because we all know that it will turn around. When it does, we will need the quality staff and facilities to handle the business.
CY: current year
PVS: per vehicle sold
TBOC: average of the top five BOC members in this category
* Some rows and columns without data have been removed to reduce table sizes.

Click to Enlarge
Chart 2 reveals new margins did not drop nearly as much as some predicted. Pre-owned margins are now less than 2007, but were up three points from 2008. Personnel expenses rose since ’07, but dropped from 2008 as dealers worked to get this under control. Flooring expenses are down considerably due to dealers dumping excess inventory and adopting more conservative ordering practices. Advertising spiked in 2008 as these dealers tried to attract buyers. Marketing budgets for 2009 were cut back.
There wasn’t much change in the service department numbers. Gross profit remained slightly below the benchmark of 70 percent while technician proficiency went up slightly to 80 percent. Net profit dollars per repair order went up $7 from 2007, but the figure was still negative at -$15.
P&A gross profit per vehicle sold climbed significantly from $545 in 2007 to $783 in 2009. This is as a result of increased sales of P&A relative to decreased unit sales.

Click to Enlarge
Chart 3 shows F&I gross profit per vehicle sold declining significantly as the credit market tightened up. This negatively affected product penetration. What can you do? Keep following the basics. Cultivate multiple lenders. Sell every F&I product. Present 100 percent of the products to 100 percent of the customers, 100 percent of the time!

Click to Enlarge
There you have it, the gory details of the effect that this market had on a group of good dealers. How do you compare? Are you doing all you can to get your expenses under control relative to the revenue for every department? Do you track the numbers necessary to do this? This has been the reason behind a significant interest in dealers wanting to join 20-groups. They have recognized how important it is to track their numbers.
If you are not in a group, we strongly encourage you to find a good 20-group and become a member. It may be the most important thing you do for your business.

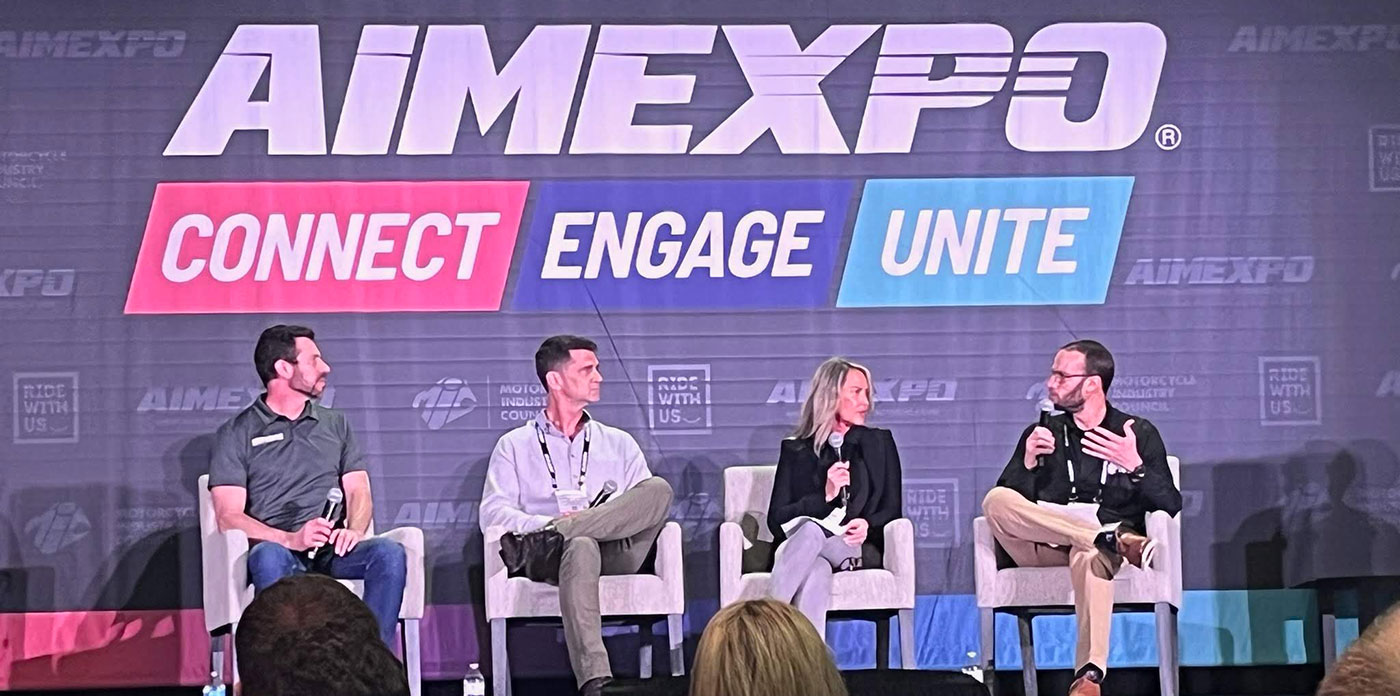

Maximize Every Sale With F&I and PG&A
This recorded AIMExpo education track discusses how the bike is just the start of the sale.
At AIMExpo 2024, Greg Jones, content director for MPN, moderated the finance and insurance (F&I) panel in MPN's Dealer Excellence education track. The panel consisted of Jason Duncan, McGraw Powersports; JD Baker, Protective Asset Protection; John McFarland, Lightspeed; and Zachary Materne, Apiar Commercial Risk Management.
In this session, Jones and the panel discuss how to maximize every sale beyond the bike with F&I and parts, gear and accessories (PG&A). The panel advises on best practices, how to make the purchase process more exciting, how to utilize technology in this process and more.
Elevating Your Sales Game Through Parts Packaging
Breaking down the art and science of a well-designed, customer-focused, profit-friendly parts package.
Unleash Your Experts: How to Be a Long-Tail Resource for Powersports Enthusiasts
Closing deals and providing service are a dealer’s bread and butter, but your dealership has far more to offer.

Building a Growth Stategy With a Powersports Playbook
Success isn’t a fluke, and it’s not luck. It’s a strategy.

Fostering an F&I Culture That Sells
Dealership success hinges on the ability to cultivate a strong F&I culture.

Other Posts
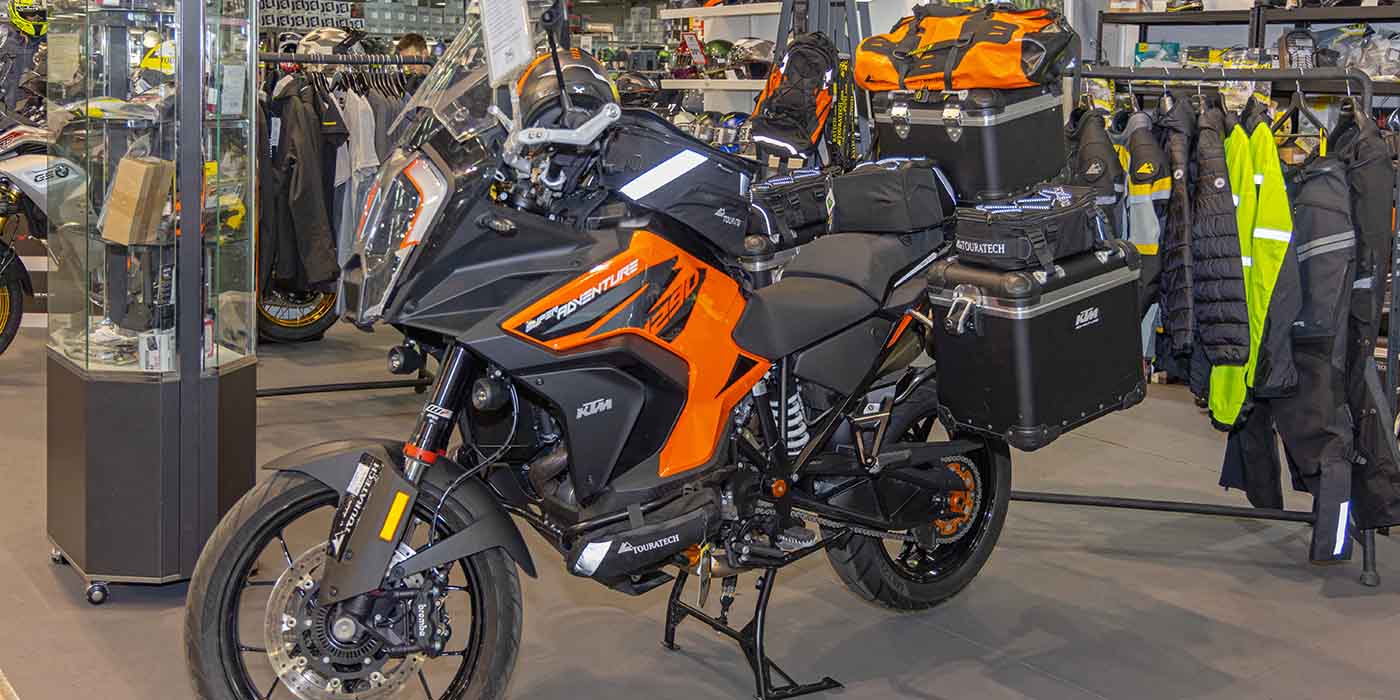
Increasing Profits Through Accessorizing
Go out and find the units to dress up — there’s lots of extra profit to be made.
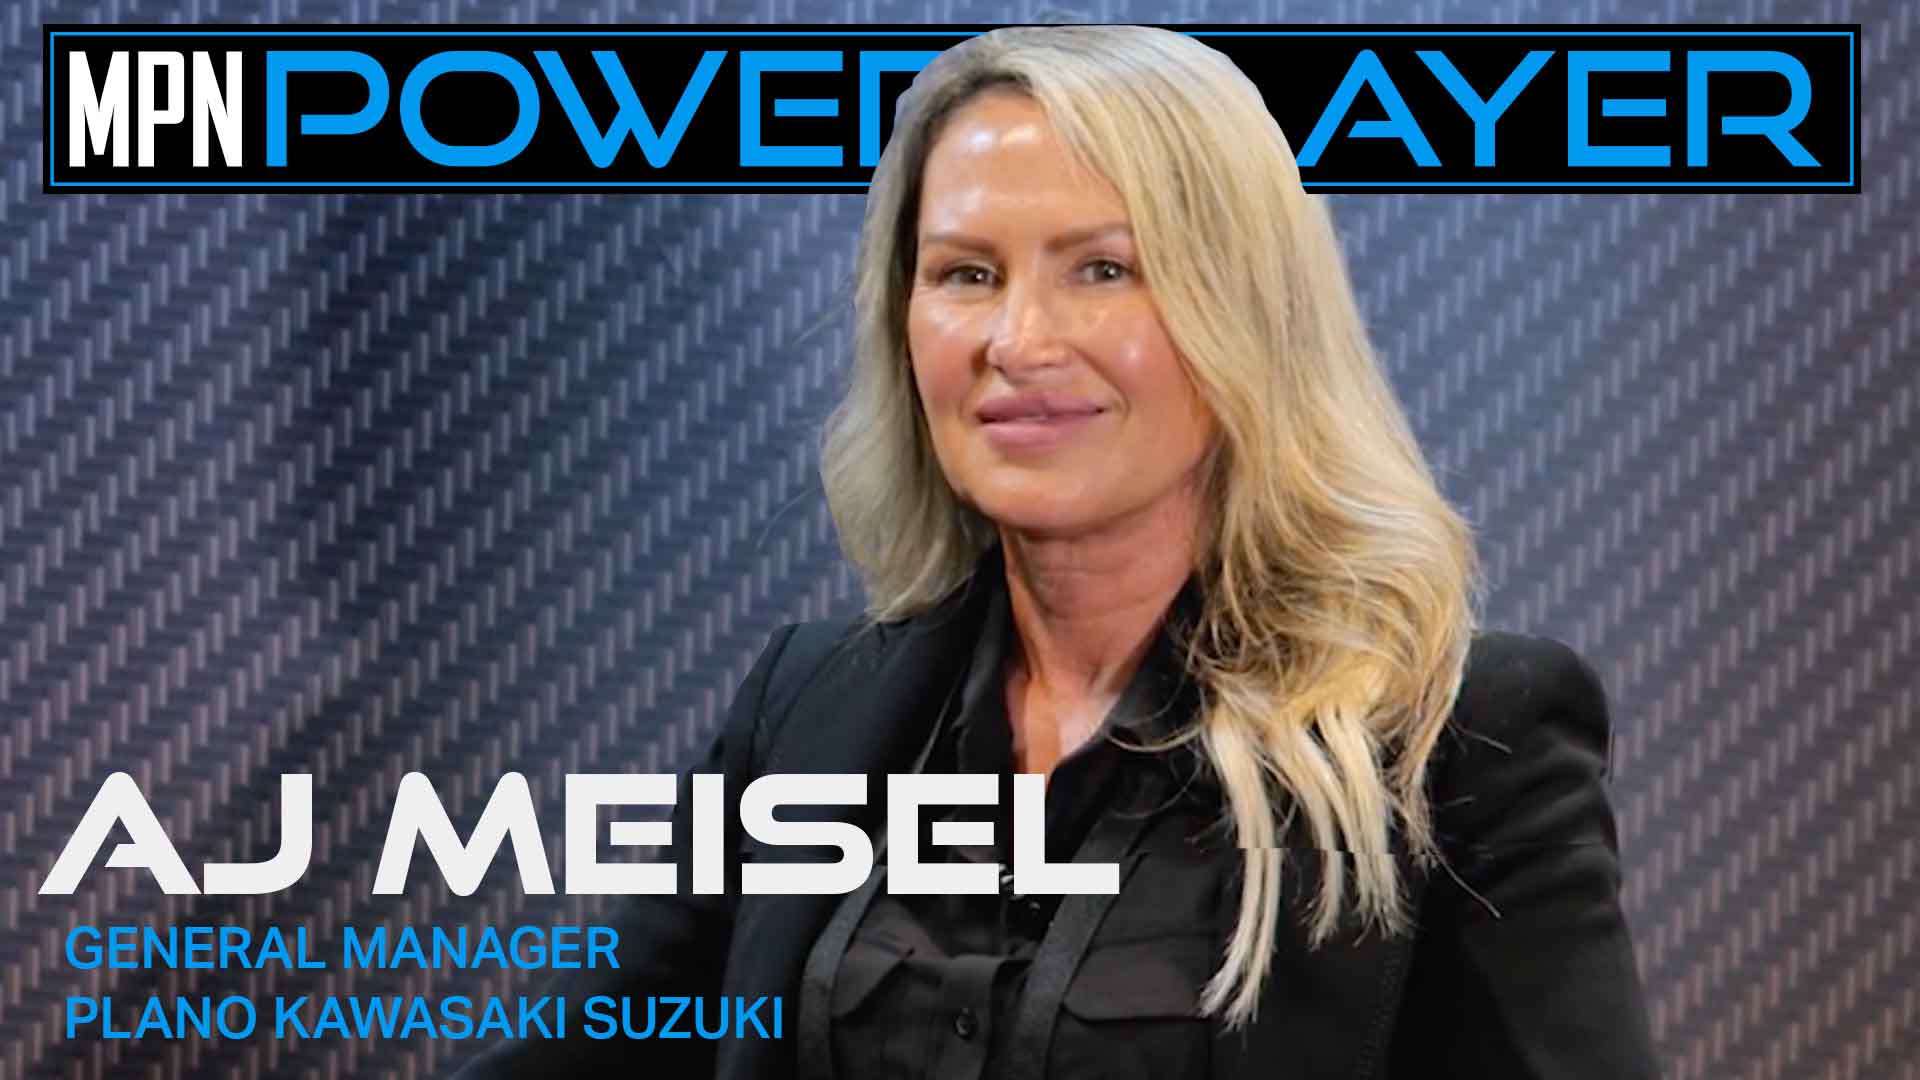
AJ Meisel Creates Community at Plano Kawasaki Suzuki
AJ has learned a thing or two over her 30-year powersports career.
Q&A: Powersports Consumer Sentiment Forecast for 2024
Consumers aren’t delaying purchases because of the economy, but they’re still looking for deals.

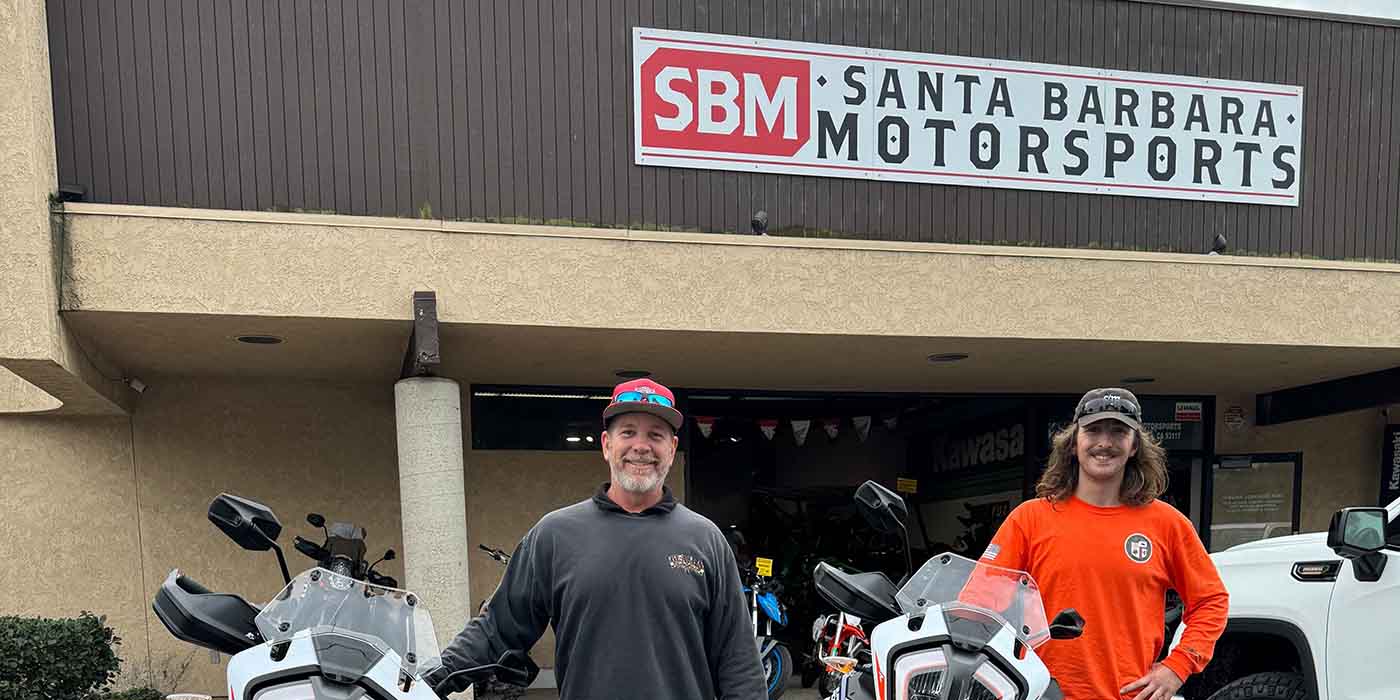
Nothing But Good Vibes at Santa Barbara Motorsports
Santa Barbara Motorsports is working to make every door swing count.