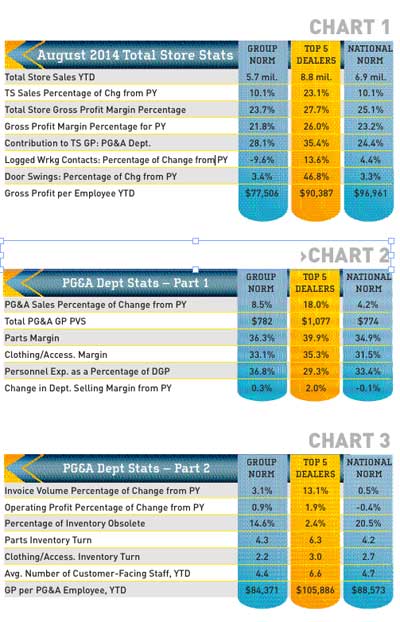
In this month’s total store stats (Chart 1), we find that sales are still growing slowly, but steadily. Since they started the year in negative numbers, this is good news. Keep in mind that these are percents of change, not percent increase numbers. More good news is that overall store margins are up across the board. A one percent increase here represents significant dollars – and all three groups are up by around two percent. Yee-haw!
You can also see that Parts, Garments & Accessories (PG&A) represents a significant contribution to the total store gross profit. It would be very beneficial to you to pay attention to the application and implementation of the best business practices that can make this department perform better.
When you look at the total store gross profit dollars per employee, you might catch that the Top 5 dealers in this group are lagging behind the National Norm (NN) numbers. That is unusual. It would also be good for this group to analyze their data to determine where the lack of gross profit per employee is coming from. It may be only a few dealers with issues that should be addressed.
In Chart 2, we see that overall PG&A sales are up. The Top 5 dealers continue to sell much more PG&A per vehicle, and they are holding better margins as well. In addition, their Personnel expenses
are lower.
Chart 3 shows invoice volume up, which goes along with increased sales. Profits are up for the group and the Top 5, but down a tad for the NN average.
Obsolescence numbers (OBS) are always vague. Looking at these numbers, I would speculate that the group dealers are mixed – some have taken the write-off on OBS, while others have not. The NN number looks “real” as far as what I see in the field. It hurts me to think that the average 20-group dealer has 20 percent of their inventory dollars tied up in stuff that hasn’t sold once in 12 months. Still, that is way better than the 30-40 percent I often see in the field. The Top 5 dealers have certainly written their old inventory off, and are probably working hard on physically eliminating it as well.
Parts turns look good (Chart 3), and accessories/clothing turns have improved slightly when compared with past numbers.
This article contains actual numbers obtained from our 20-group data reporting and analysis system. 20-groups consist of dealers from non-competing markets who meet 3 times a year to share financial and best practice information. Their goal is to grow and improve their businesses profitably.
Definitions:
TS = Total Store;
GP = Gross Profit;
DGP = Department Gross Profit;
PY = Prior Year;
PVS = Per Vehicle Sold;
National Norm (NN) = Average for all our metric 20-groups;
Top 5 = Top 5 dealers by line item for the selected group
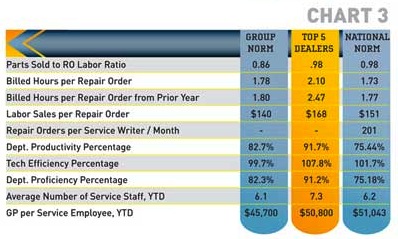
The bottom line is, literally, the bottom line here. Gross profit dollars per employee shows a huge difference between the NN and group number, and the Top 5. Why? Look at the gross profit dollars per vehicle sold, the higher margins they get, the lower employee payroll and the number of turns. It isn’t an accident. These dealers do a better job of implementing the processes and hiring better quality staff. They also provide their staff with ongoing training. I know, because we see their managers in our classes. The formula for success in this department is not complicated; you just have to make the effort to apply it – and do so consistently.
Steve Jones, GSA senior projects manager, recaps critical measurements used by the leading 20-group dealers. Access to GSA’s Voyager 5 data analysis & comparison system is available for any dealership for a nominal fee. For more information on Voyager, management workshops, dealer 20-groups, on-site consulting or training, send an email to [email protected] or visit www.gartsutton.com.