The 2011 dealership data is in, and overall it looks pretty good. It is certainly much better than what we have seen for the last couple of years. While we’re not out of the woods, we’re into mostly positive numbers that are trending slowly and steadily upward.
One thing that stands out as we go through these numbers is the huge difference between the TBOC (top five dealers averaged per line item) and the rest of the dealer universe. It quickly becomes obvious that these dealers are on the gas when it comes to controlling expenses and producing income.
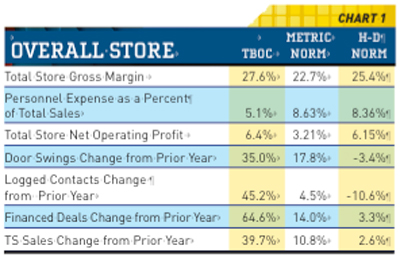 The Overall Store (Chart 1) shows that the top dealers are holding good gross and net numbers. Despite high expenses in many areas, H-D dealers have a very good net. Door swings and logged contacts are up for metric dealers, but down for H-D dealers. Check out the financed deals change for the TBOC dealers. These folks have obviously made a considerable effort to improve in this area. If you can get the unit financed, you not only increase unit sales, you open the door for add-on F&I and P&A sales. You can see this reflected in the nearly 40 percent increase in total store sales as compared with last year.
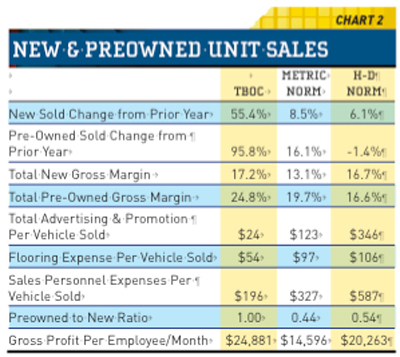 Chart 2 pounds home the exceptional performance of the TBOC dealers. They’ve managed to increase new and pre-owned sales by staggering amounts while keeping advertising, flooring and personnel expenses well below the national norms. Some of this increase in sales came from inexpensive grassroots marketing (shows and events), website marketing and social media. However, I have no doubt there was a lot of good old-fashioned prospecting through email, direct mail and mass quantities of phone calls. I had one dealer tell me that his staff was calling prior customers as far back as five years. He said they may have to make dozens of calls to get one sale, but they were “making it happen.” Their efforts were also significantly increasing customer traffic that will result in more sales.
Note the 1:1 pre-owned-to-new ratio. TBOC dealers are selling one pre-owned for every new unit they sell. Why? How about 24 percent margins on pre-owned units as compared with 17 percent for new? This helps control advertising and flooring costs as well.
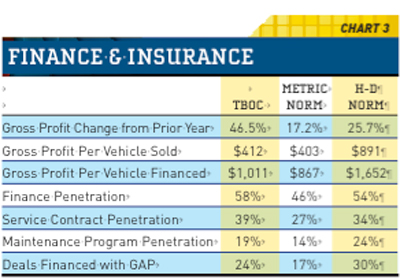 In F&I (Chart 3), TBOC is showing more of the results of pursuing improved financing sources. The H-D dealers are also performing well, particularly in finance penetration and gross profit dollars per vehicle financed. Priority maintenance programs are selling again, and GAP sales are up considerably from previous years. GAP can have real benefits for purchasers of expensive motorcycles, PWCs or UTVs, and it is actually endorsed by many consumer advocates.
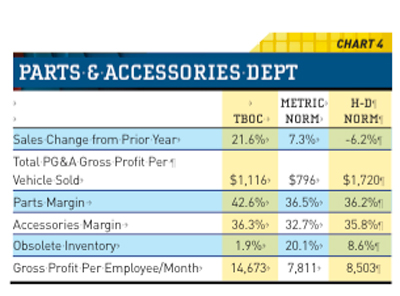 Note that in Chart 4, we include clothing under the accessories label. In the future, we will separate this out. P&A has the most potential for profit margin in the entire dealership. It also ties up a lot of operating capital. Keeping your inventory turning is essential to keeping your dealership healthy and profitable. It is vital that you have the right people managing this department. TBOC sales are up more than 20 percent from last year — selling more units leads to increased P&A sales. Interestingly, H-D is down 6 percent from last year. However, they hold a strong $1,700 per vehicle sold. Margins look generally good, although clothing and accessories is a bit anemic for the metric norm. Obsolescence is a big issue for the metric dealers as well. The goal is to keep this under 10 percent, which TBOC and the H-D dealers have been able to maintain.
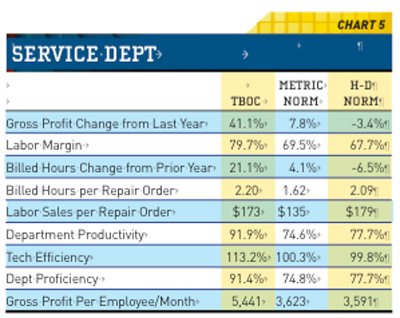 Service gross profit (Chart 5) is way up for TBOC, up for the metric dealers and down for the H-D dealers. Their loss of billed hours and low margins are the issue here. The metric dealers could work on bringing up their hours per repair order. Both metric and H-D dealers would do well to focus on improving the productivity of their service departments.
I hope these road signs will help guide you as you set your goals for the coming year. Please let us know how we can help you develop and implement the best business processes necessary to achieve your goals.
Steve Jones, GSA senior projects manager, outlines dealership best business practices to boost margins, increase profitability and retain employees. His monthly column recaps critical measurements used by the leading 20-group dealers. GSA is recognized as the industry’s #1 authority on dealer profitability.
Access to the new Voyager 5 data reporting and analysis system is available for any dealership for nominal fee.
For more information on GSA’s data reporting system, dealer 20-groups, on-site consulting or training, email [email protected] or visit www.gartsutton.com.