This month, we’ll compare April 2012 service department data from one of our metric dealer 20-groups against the National Norm numbers (overall averages for all our metric 20-groups) and the average of the Top 5 performing dealers in each category.
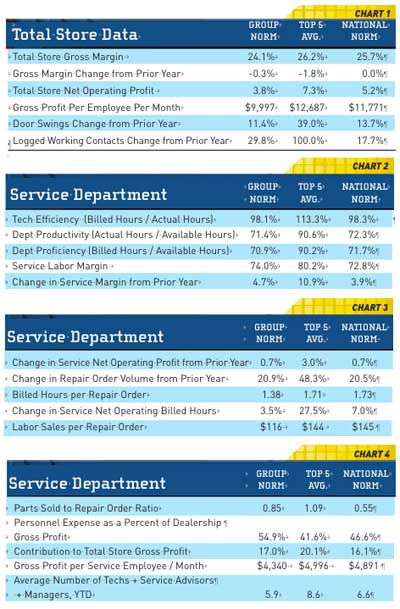
Chart 1 contains updated specs for specific areas of total store performance. This allows you to review the service department numbers in relation to what is happening with the overall store.
Notice that the total store gross margin is down very slightly for the group norm and down more among the Top 5 dealers. Even so, they remain above the target gross profit margin benchmark of 25 percent. The National Norm dealers remained even with last year at a respectable 25.7 percent. Total store net operating profit is pretty good at over 7 percent for the Top 5 dealers and decent for the National Norm dealers. It is really nice to see positive net numbers.
The gross profit per employee is something you can measure in your own store. It is one of those comparisons that shouldn’t change significantly regardless of store size, provided the best business processes are implemented and maintained. If you are doing everything else correctly, it can be an indicator of whether you are over- or under-staffed.
Door swings are up again — more good signs that business is growing. The logged working contacts increase is not only due to the increase in traffic, it is because the dealers are requiring staff to use their traffic log system (whether written or electronic). The log should be at the heart of your sales operation. Among other things, the log tracks traffic flow (amount and time) and provides data on the response to your advertising and placement (“Where did you hear about us?”; “What brings you in today?”). More importantly, the log captures essential prospect contact and follow-up information and tracks the performance of your sales staff. The importance of this tool cannot be over-emphasized.
In Chart 2 you will see the key measurements for the service department. All of these numbers are significantly affected by the proper use of tech time. Any minute that a tech is not on the clock turning billable hours is a potential loss for the department and the dealership. I recommend that available hours be based on the hours that the tech was scheduled to work, since this is the number that drives the department budget — it is the potential hours you have to sell. The other option is to use the hours that the tech actually clocked in for the entire day. I maintain that is not realistic because your performance data should show a discrepancy if the tech doesn’t show up for his or her full shift.
None of the three following measurements can be accurately gathered without the use of a time clock. I know, I have tried.
Tech efficiency, which measures the technician’s effectiveness at completing the jobs in a timely manner, should be around 100 percent. Techs that consistently outperform flat rate times will be higher — see the Top 5. This is generally the result of using menu-driven selling systems and/or the promotion of repetitive, quick-turn jobs like interval services, tune-ups and tire changes where experienced techs can beat flat rate times.
Department productivity reflects the service manager’s ability to keep work flowing through the service department. Proper staging and support systems as well as providing two or three lifts per tech will help increase this number. The benchmark is 85 percent. It is attainable, but not easily reached. The 90.6 percent shown by the Top 5 dealers is very
impressive.
Proficiency is a close representation of the overall profitability of the department, since it compares the billed hours against the total hours available for the tech to work. Again, 85 percent is the target.
Service labor margin represents total revenue less cost of sales. This cost is tech wages, not including benefits (which are classed as admin expenses). You would also include sublet labor as a part of COS. The goal here is a 70 percent gross profit margin, which means tech wages can’t exceed 30 percent of revenue. That is the size of the “bucket” you have to pay your techs. If techs need more money, you have to increase revenue in order to get there. The numbers here show that these dealers are all doing an excellent job of controlling wages while producing revenue.
70 percent seems like a big margin — until you consider that everything else has to be paid from this. Admin expenses, facility expenses, marketing/advertising, good will, personnel expenses (service manager, service advisors, shop foreman, lot porters, etc.), and things like shop supplies all have to come out of gross profit. Service is not a high-profit area for most dealerships. However, service accounts for the major portion of repeat unit sales. According to industry surveys, it’s the single biggest factor influencing a customer’s decision to buy another unit from the same dealer.
Things are looking up in Chart 3. Net operating profit is barely up for the group and the National Norm, but up significantly for the Top 5 dealers. Repair order volume is up considerably, but billed hours per repair order is only up a little. It falls short of the target of two hours per repair order. It is essential that your service advisors have proper service writing and sales training and follow a structured write-up process with a checklist. This is the basis for increasing sales per repair order and for improving customer satisfaction. It is a proven fact that customers are much happier if you catch their servicing needs at the time of the write-up. Each additional phone call to solicit add-on services or parts will decrease your CSI.
Chart 4 The parts sold to repair order ratio is a bit shy of the 1:1 we typically see. It is down significantly in the case of the National Norm dealers. This could be a result of the service advisors not doing a good job of selling additional parts and service during the write-up process. It could also show that they do not have sufficient service advisors to cover the busy periods. This results in them not having the time to establish rapport with their customers, not properly probing for their needs and not presenting solutions as they should be doing. The end result: poor sales and low dollars per repair order.
You can use the personnel expense as a percentage of dealership gross profit figure to compare with your store, regardless of size. The same holds true of gross profit dollars per employee as well. As a reference to average dealership size, I have included the staffing figures.
Take a hard look at your service operation, and use this information to compare. As always, feel free to contact me for information, explanation or to discuss how we can help you grow your business profitably.